Technical Analysis of IBDV 2024-05-10
Overview:
In analyzing the technical indicators for IBDV stock over the last 5 days, we will delve into the trend, momentum, volatility, and volume indicators to provide a comprehensive outlook on the possible stock price movement in the coming days. By examining these key indicators, we aim to offer valuable insights and recommendations for potential investors.
Trend Analysis:
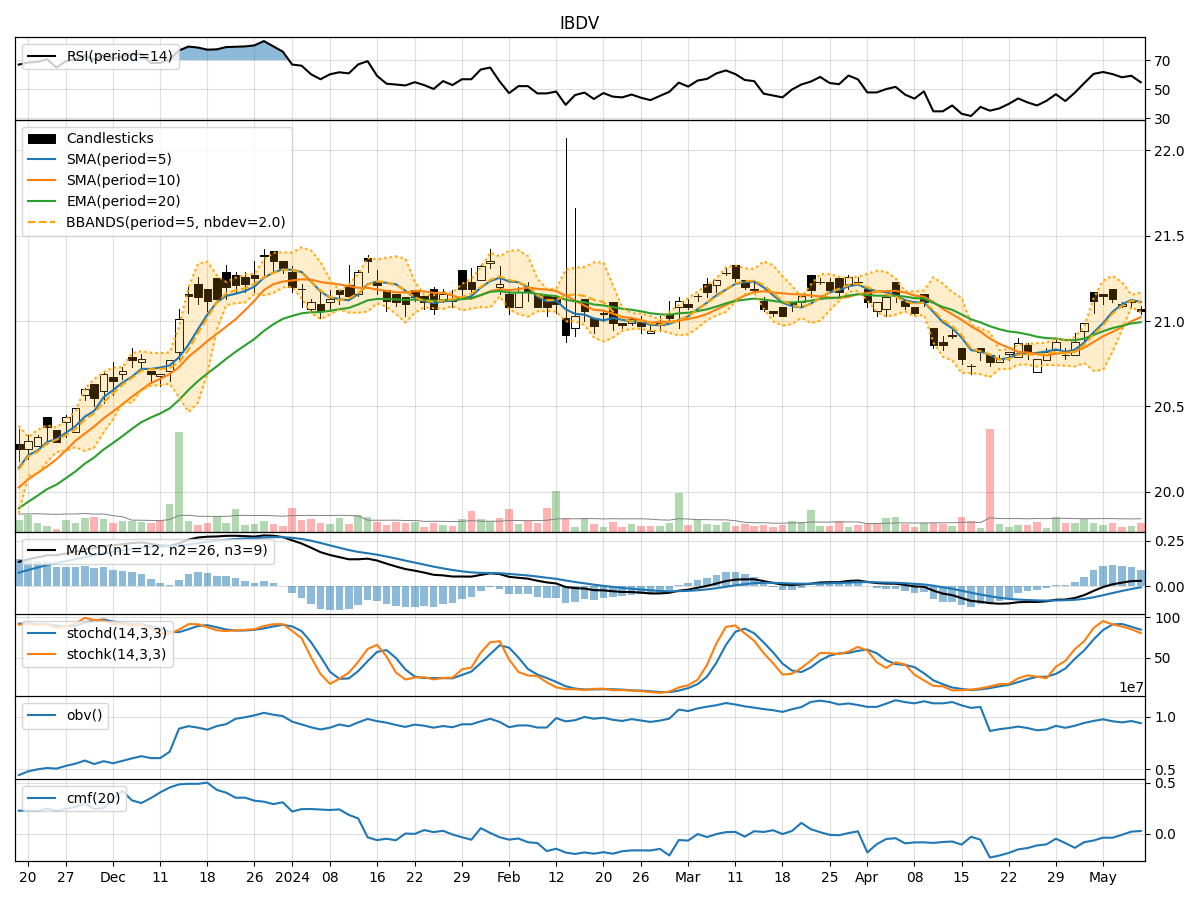
- Moving Averages (MA): The 5-day MA has been showing a slight uptrend, indicating a positive momentum in the short term.
- MACD: The MACD line has been consistently above the signal line, suggesting a bullish trend.
- RSI: The RSI values have been fluctuating around the neutral zone, indicating a balanced market sentiment.
Key Observation: The trend indicators suggest a mildly bullish sentiment in the short term.
Momentum Analysis:
- Stochastic Oscillator: Both %K and %D values have been gradually decreasing, signaling a potential reversal in momentum.
- Williams %R: The Williams %R values have been in the oversold territory, indicating a possible buying opportunity.
Key Observation: Momentum indicators are showing signs of a potential reversal or consolidation.
Volatility Analysis:
- Bollinger Bands: The stock price has been trading within the bands, indicating a period of consolidation.
- Volatility Bands: The volatility has been decreasing, suggesting a stabilization in price movements.
Key Observation: Volatility indicators point towards a period of consolidation or sideways movement.
Volume Analysis:
- On-Balance Volume (OBV): The OBV values have been fluctuating, indicating indecision among investors.
- Chaikin Money Flow (CMF): The CMF values have been hovering around the zero line, reflecting a neutral money flow.
Key Observation: Volume indicators suggest a lack of clear direction in investor sentiment.
Conclusion:
Based on the analysis of the technical indicators, the next few days for IBDV stock are likely to see sideways movement or consolidation. The trend indicators show a mildly bullish sentiment, while momentum indicators hint at a potential reversal or consolidation phase. Volatility indicators point towards a period of stabilization, and volume indicators reflect indecision among investors.
Overall, the stock is expected to trade within a narrow range in the coming days, with no clear trend direction. Investors should exercise caution and closely monitor key support and resistance levels for potential trading opportunities.