Technical Analysis of IBDX 2024-05-10
Overview:
In analyzing the technical indicators for IBDX stock over the last 5 days, we will delve into the trend, momentum, volatility, and volume indicators to provide a comprehensive outlook on the possible stock price movement in the coming days. By examining these key aspects, we aim to offer valuable insights and recommendations for potential investors.
Trend Analysis:
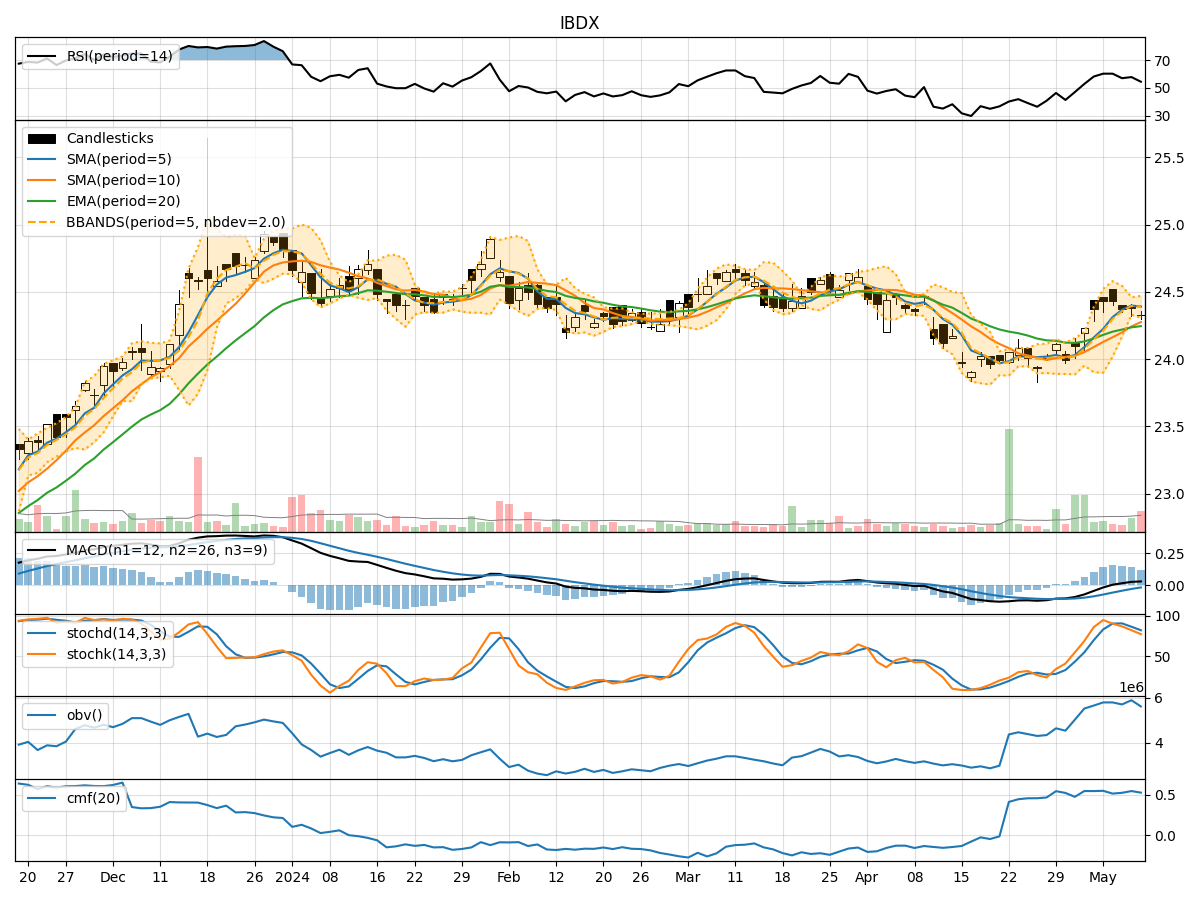
- Moving Averages (MA): The 5-day Moving Average (MA) has been consistently above the Simple Moving Average (SMA) and Exponential Moving Average (EMA), indicating a short-term bullish trend.
- MACD: The MACD line has been consistently above the signal line, with the MACD Histogram showing positive values, suggesting bullish momentum.
Momentum Analysis:
- RSI: The Relative Strength Index (RSI) has been fluctuating around the 50 level, indicating a neutral momentum in the stock.
- Stochastic Oscillator: Both %K and %D lines of the Stochastic Oscillator have been trending downwards, signaling a potential bearish momentum.
Volatility Analysis:
- Bollinger Bands (BB): The stock price has been trading within the Bollinger Bands, with the bands narrowing, suggesting decreasing volatility.
- Bollinger %B: The %B indicator is hovering around the midline, indicating a balanced market sentiment.
Volume Analysis:
- On-Balance Volume (OBV): The OBV indicator has shown mixed signals, with no clear trend in volume accumulation or distribution.
- Chaikin Money Flow (CMF): The CMF has been fluctuating around the zero line, indicating a neutral money flow in the stock.
Conclusion:
Based on the analysis of the technical indicators, the stock of IBDX is likely to experience sideways movement in the coming days. The trend indicators suggest a bullish bias in the short term, supported by the moving averages and MACD. However, the momentum indicators, particularly the Stochastic Oscillator, point towards a potential bearish reversal in momentum. The volatility indicators indicate decreasing volatility, which could lead to a period of consolidation.
Considering the mixed signals from the volume indicators, it is essential for investors to exercise caution and closely monitor the price action. In conclusion, while the short-term trend appears bullish, the conflicting signals from momentum and volume indicators suggest a potential consolidation phase or sideways movement for IBDX stock in the near future. Investors should wait for more clarity in the market dynamics before making significant trading decisions.