Technical Analysis of IBDY 2024-05-10
Overview:
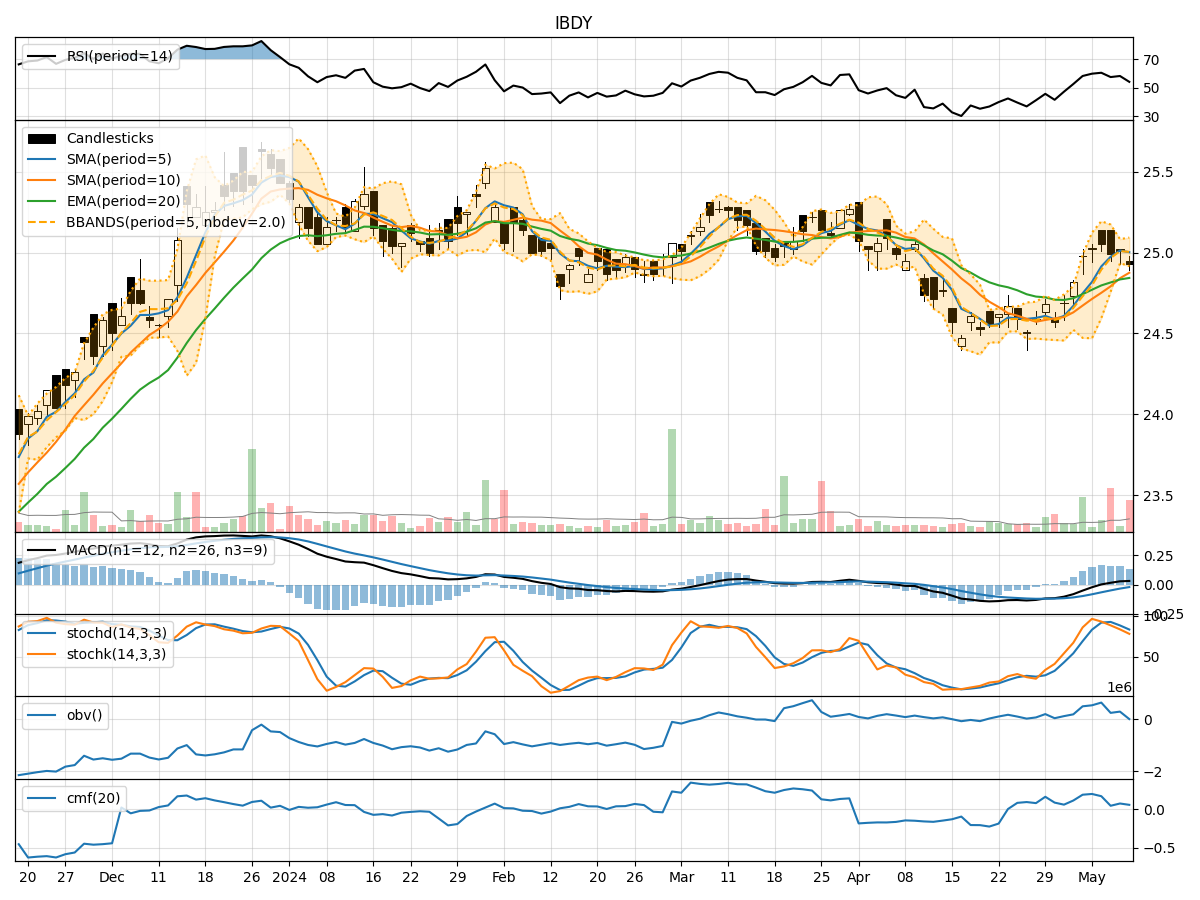
In the last 5 trading days, IBDY stock has shown mixed signals across various technical indicators. The stock price has been fluctuating within a narrow range, indicating indecision in the market. We will analyze the trend, momentum, volatility, and volume indicators to provide insights into the possible future price movement of IBDY stock.
Trend Indicators:
- Moving Averages (MA): The 5-day Moving Average (MA) has been slightly above the Simple Moving Average (SMA) and Exponential Moving Average (EMA), indicating a short-term bullish trend.
- MACD: The MACD line has been consistently above the signal line, suggesting a bullish momentum in the stock price.
- MACD Histogram: The MACD Histogram has been gradually decreasing but still in positive territory, indicating a potential slowdown in the bullish momentum.
Momentum Indicators:
- RSI: The Relative Strength Index (RSI) has been fluctuating around the 50 level, indicating a lack of strong momentum in either direction.
- Stochastic Oscillator: Both %K and %D lines of the Stochastic Oscillator have been declining, suggesting a potential bearish momentum.
- Williams %R: The Williams %R indicator has been in oversold territory, indicating a possible reversal in the stock price.
Volatility Indicators:
- Bollinger Bands: The Bollinger Bands have been narrowing, indicating decreasing volatility in the stock price.
- Bollinger %B: The %B indicator has been hovering around the midline, suggesting a balanced market sentiment.
- Bollinger Band Width: The Band Width has been decreasing, indicating a potential decrease in volatility.
Volume Indicators:
- On-Balance Volume (OBV): The OBV has been fluctuating, indicating mixed buying and selling pressure in the stock.
- Chaikin Money Flow (CMF): The CMF has been relatively low, suggesting a lack of strong buying or selling pressure.
Key Observations:
- The trend indicators suggest a short-term bullish bias in the stock price.
- Momentum indicators show a lack of strong momentum in either direction.
- Volatility indicators indicate decreasing volatility in the stock price.
- Volume indicators reflect mixed buying and selling pressure in the stock.
Conclusion:
Based on the analysis of technical indicators, the next few days' possible stock price movement for IBDY stock is likely to consolidate within the current range. The lack of strong momentum, decreasing volatility, and mixed volume signals suggest a period of indecision in the market. Traders may expect the stock price to trade sideways in the near term until a clear trend direction emerges. It is advisable to closely monitor key support and resistance levels for potential breakout or breakdown scenarios.