Technical Analysis of IBHD 2024-05-10
Overview:
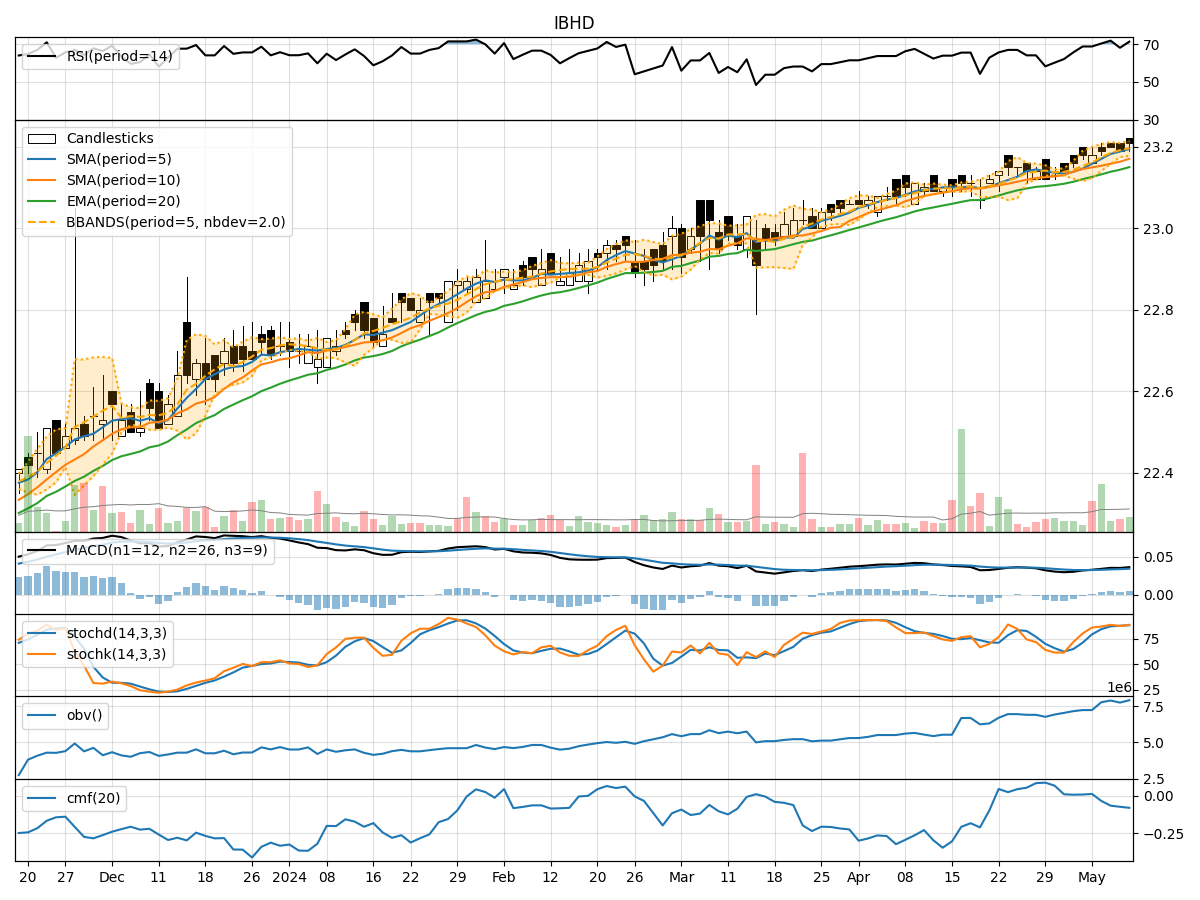
In analyzing the technical indicators for IBHD stock over the last 5 days, we will delve into the trend, momentum, volatility, and volume indicators to provide a comprehensive outlook on the possible stock price movement in the coming days. By examining key metrics such as moving averages, MACD, RSI, Bollinger Bands, and OBV, we aim to offer valuable insights and recommendations for potential trading strategies.
Trend Indicators:
- Moving Averages (MA): The 5-day MA has been consistently above the closing prices, indicating a short-term uptrend.
- MACD: The MACD line has been trending upwards, with the MACD histogram showing increasing positive values, suggesting bullish momentum.
- EMA: The exponential moving average has been steadily rising, supporting the bullish trend.
Momentum Indicators:
- RSI: The RSI has been in the overbought territory, indicating strong buying momentum.
- Stochastic Oscillator: Both %K and %D have been in the overbought zone, signaling a potential reversal.
- Williams %R: The indicator has been in the oversold region, suggesting a possible buying opportunity.
Volatility Indicators:
- Bollinger Bands: The stock price has been trading within the bands, with the bands widening slightly, indicating increased volatility.
- Bollinger %B: The %B indicator has been fluctuating around the midline, suggesting a balanced market sentiment.
Volume Indicators:
- On-Balance Volume (OBV): The OBV has been relatively flat, indicating a lack of strong volume confirmation for the recent price movements.
- Chaikin Money Flow (CMF): The CMF has been negative, reflecting selling pressure in the stock.
Key Observations:
- The trend indicators suggest a bullish bias, supported by the moving averages and MACD.
- Momentum indicators show conflicting signals, with RSI in overbought territory and stochastic oscillators hinting at a potential reversal.
- Volatility has increased slightly, as seen in the widening Bollinger Bands.
- Volume indicators do not provide a clear confirmation of the recent price movements.
Conclusion:
Based on the analysis of the technical indicators, the stock price of IBHD is likely to experience a period of consolidation in the near term. While the trend indicators point towards a bullish bias, the conflicting signals from momentum indicators and the lack of strong volume confirmation suggest a potential sideways movement. Traders should exercise caution and wait for clearer signals before initiating new positions.