Technical Analysis of IBHE 2024-05-10
Overview:
In analyzing the technical indicators for IBHE stock over the last 5 days, we will delve into the trend, momentum, volatility, and volume indicators to provide a comprehensive outlook on the possible future stock price movement. By examining these key aspects, we aim to offer valuable insights and predictions for the upcoming trading days.
Trend Analysis:
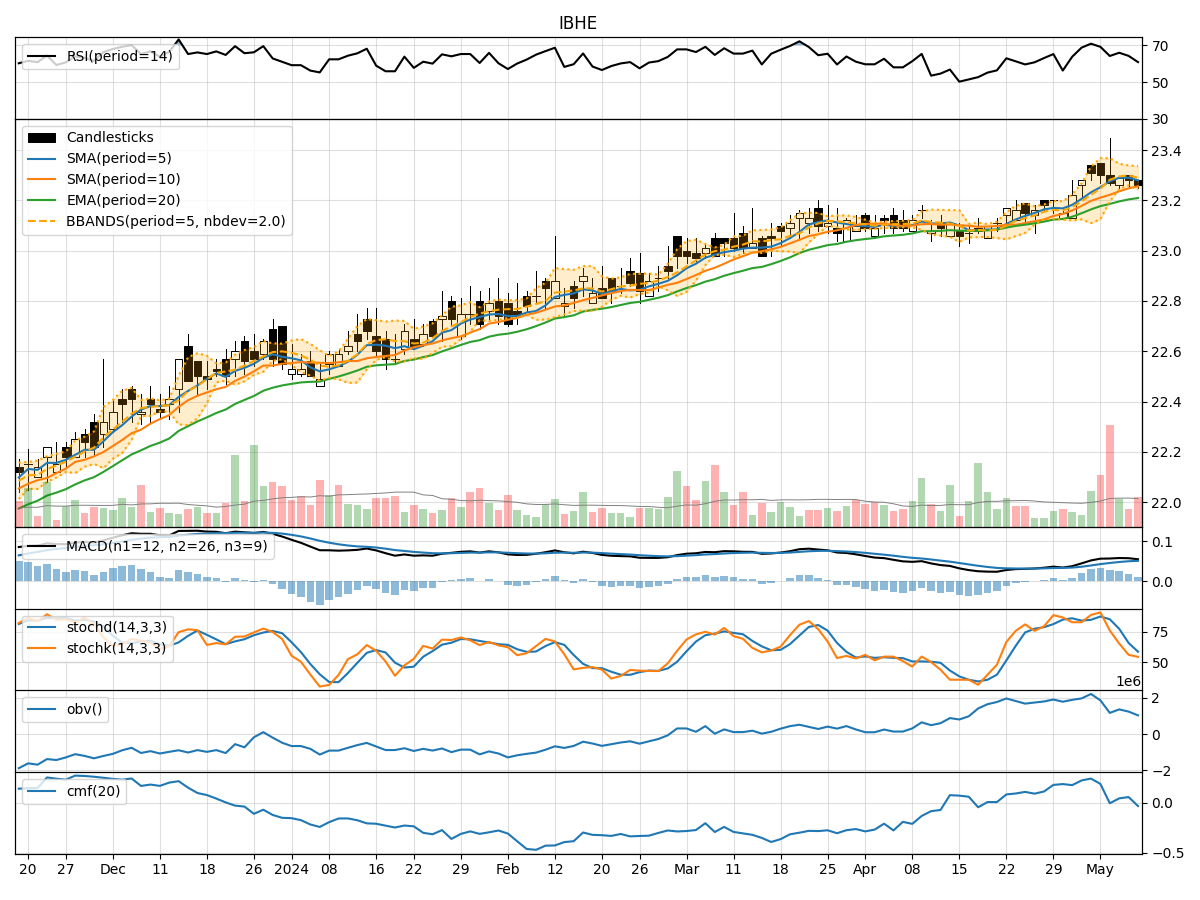
- Moving Averages (MA): The 5-day Moving Average (MA) has been relatively stable around the closing prices, indicating a consistent trend.
- MACD: The Moving Average Convergence Divergence (MACD) has shown a slight positive trend, with the MACD line consistently above the signal line.
- EMA: The Exponential Moving Average (EMA) has been gradually increasing, reflecting a bullish sentiment in the short to medium term.
Momentum Analysis:
- RSI: The Relative Strength Index (RSI) has been fluctuating but generally staying within the neutral range, suggesting a balanced momentum.
- Stochastic Oscillator: Both %K and %D have been declining, indicating a potential weakening of momentum.
- Williams %R: The Williams %R has been in the oversold territory, signaling a possible reversal in momentum.
Volatility Analysis:
- Bollinger Bands: The Bollinger Bands have been narrowing, indicating decreasing volatility and a potential upcoming breakout.
- Bollinger %B: The %B indicator has been hovering around the midline, suggesting a period of consolidation.
Volume Analysis:
- On-Balance Volume (OBV): The OBV has shown mixed signals, with fluctuations in volume accumulation.
- Chaikin Money Flow (CMF): The CMF has been positive, indicating buying pressure in the market.
Key Observations:
- The trend indicators suggest a bullish sentiment in the short to medium term.
- Momentum indicators show a mixed picture, with some signs of potential weakness in momentum.
- Volatility is decreasing, indicating a period of consolidation.
- Volume indicators reflect mixed signals, with fluctuations in volume accumulation.
Conclusion:
Based on the analysis of the technical indicators, the next few days for IBHE stock could see sideways movement with a slight bullish bias. Traders should monitor key levels closely for potential breakout or reversal signals. It is advisable to wait for confirmation from price action before making significant trading decisions.