Technical Analysis of IBHH 2024-05-10
Overview:
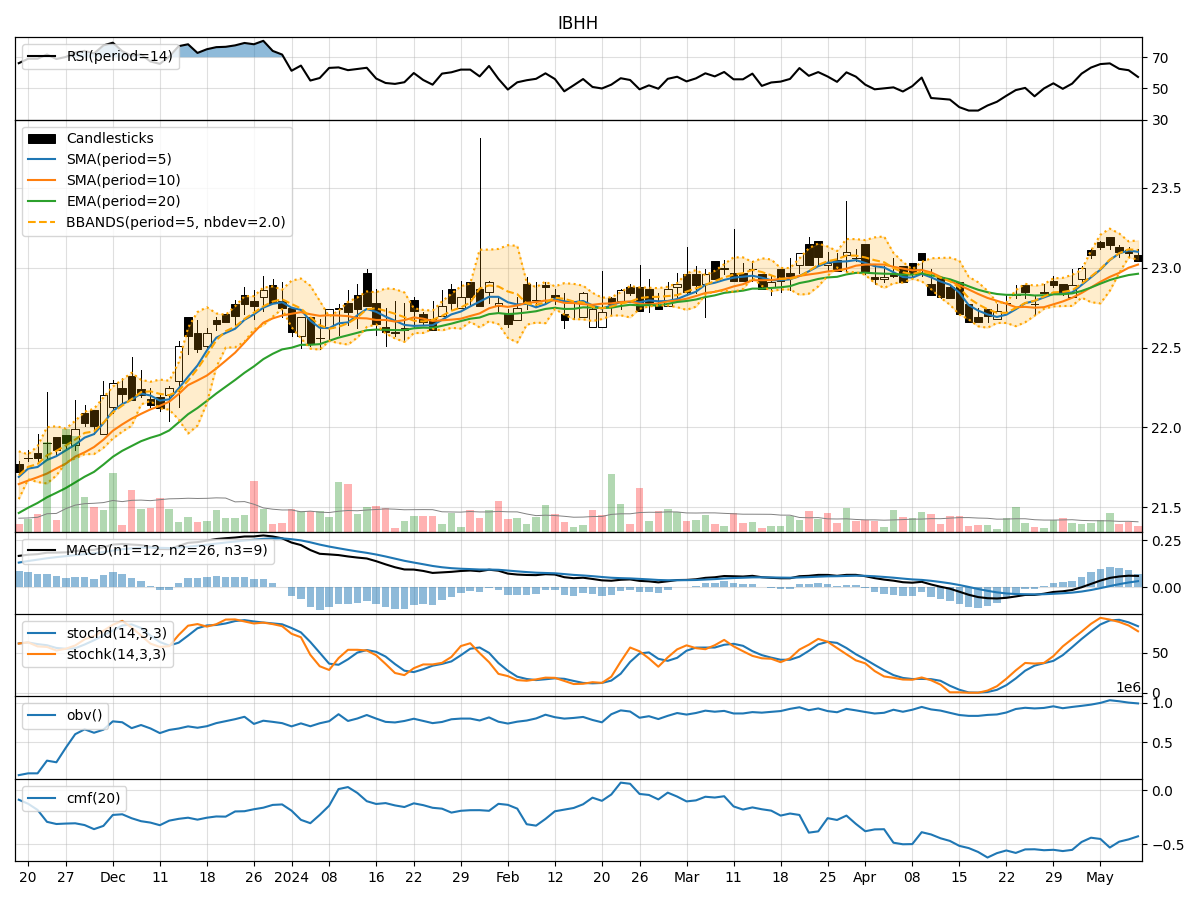
In analyzing the technical indicators for IBHH stock over the last 5 days, we will delve into the trends, momentum, volatility, and volume indicators to provide a comprehensive outlook on the possible stock price movement in the coming days. By examining key metrics such as moving averages, MACD, RSI, Bollinger Bands, and OBV, we aim to offer valuable insights and predictions for potential price action.
Trend Indicators:
- Moving Averages (MA): The 5-day MA has been relatively stable around the closing prices, indicating a short-term trend.
- MACD: The MACD line has shown a slight positive trend, with the MACD histogram also displaying an uptrend.
- EMA: The EMA has been gradually increasing, suggesting a bullish sentiment in the stock.
Key Observation: The trend indicators point towards a slightly bullish outlook for IBHH stock.
Momentum Indicators:
- RSI: The RSI values have been fluctuating around the mid-range, indicating a neutral momentum.
- Stochastic Oscillator: Both %K and %D values have been declining, signaling a potential weakening momentum.
- Williams %R: The indicator has been in the oversold territory, suggesting a possible reversal.
Key Observation: Momentum indicators reflect a neutral to slightly bearish sentiment for IBHH stock.
Volatility Indicators:
- Bollinger Bands: The stock price has been trading within the bands, indicating a period of consolidation.
- Bollinger %B: The %B value has been hovering around the middle, suggesting a balanced volatility level.
Key Observation: Volatility indicators imply a consolidation phase for IBHH stock.
Volume Indicators:
- On-Balance Volume (OBV): The OBV values have been fluctuating, indicating mixed buying and selling pressure.
- Chaikin Money Flow (CMF): The CMF values have been negative, signaling a lack of strong buying interest.
Key Observation: Volume indicators suggest a lack of clear direction in terms of buying or selling pressure.
Conclusion:
Based on the analysis of trend, momentum, volatility, and volume indicators, the overall outlook for IBHH stock in the next few days appears to be sideways with a slight bearish bias. While the trend indicators show a slightly bullish sentiment, the momentum indicators lean towards a neutral to bearish stance. Volatility indicators suggest a consolidation phase, and volume indicators indicate mixed buying and selling pressure.
Key Conclusion: The stock is likely to experience sideways movement with a potential downside bias in the near term. Traders should exercise caution and closely monitor key support and resistance levels for potential trading opportunities.
Remember, market conditions can change rapidly, so it's essential to stay updated with real-time data and adjust your trading strategy accordingly.