Technical Analysis of IBHI 2024-05-10
Overview:
In analyzing the technical indicators for IBHI stock over the last 5 days, we will delve into the trends, momentum, volatility, and volume aspects to provide a comprehensive outlook on the possible stock price movement in the coming days.
Trend Analysis:
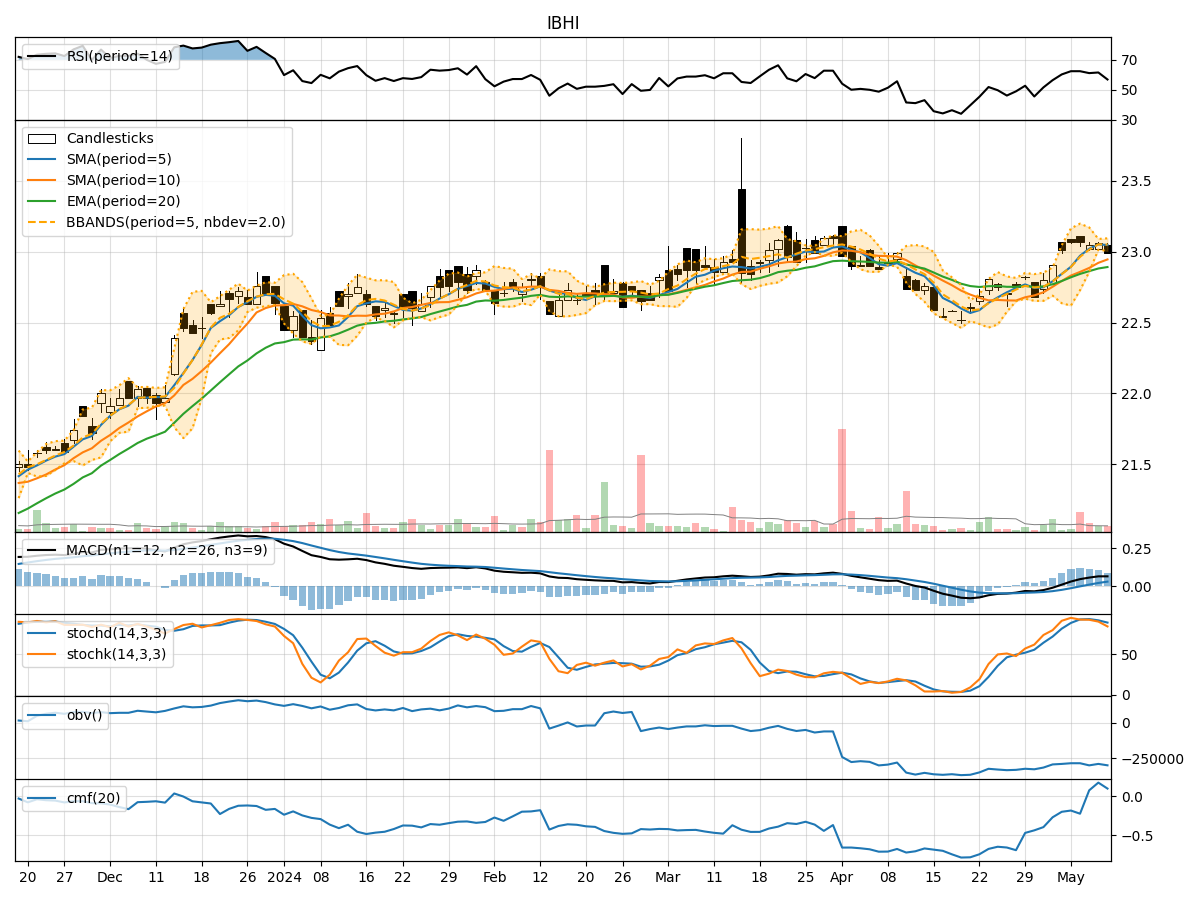
- Moving Averages (MA): The 5-day Moving Average (MA) has been consistently above the Simple Moving Average (SMA) and Exponential Moving Average (EMA), indicating a bullish trend.
- MACD: The MACD line has been consistently above the signal line, with the MACD Histogram showing positive values, suggesting a bullish momentum.
Momentum Analysis:
- RSI: The Relative Strength Index (RSI) has been fluctuating around the 60-65 range, indicating a neutral momentum.
- Stochastic Oscillator: Both %K and %D have been gradually decreasing but still in the overbought territory, suggesting a potential reversal.
Volatility Analysis:
- Bollinger Bands (BB): The stock price has been trading within the Bollinger Bands, with the bands narrowing, indicating decreasing volatility.
- Bollinger %B: The %B indicator has been hovering around the middle range, signifying a neutral stance in terms of volatility.
Volume Analysis:
- On-Balance Volume (OBV): The OBV has been fluctuating, indicating indecision among investors regarding the stock.
- Chaikin Money Flow (CMF): The CMF has shown slight positive movement, suggesting some buying pressure.
Key Observations:
- The trend indicators suggest a bullish sentiment, supported by the MACD analysis.
- Momentum indicators show a neutral stance with a potential reversal in the stochastic oscillator.
- Volatility has been decreasing, indicating a possible consolidation phase.
- Volume indicators reflect indecision among investors, with a slight positive bias in the CMF.
Conclusion:
Based on the analysis of the technical indicators, the next few days for IBHI stock are likely to see sideways movement with a slight bullish bias. Investors should closely monitor the stochastic oscillator for a potential reversal signal and keep an eye on the OBV for any significant shifts in volume sentiment. Overall, the stock is expected to consolidate within a narrow range before potentially resuming its bullish trend.