Technical Analysis of IBHJ 2024-05-10
Overview:
In analyzing the technical indicators for IBHJ stock over the last 5 days, we will delve into the trends, momentum, volatility, and volume indicators to provide a comprehensive outlook on the possible stock price movement in the coming days. By examining key metrics such as moving averages, MACD, RSI, Bollinger Bands, and OBV, we aim to offer valuable insights and recommendations for potential investors.
Trend Indicators:
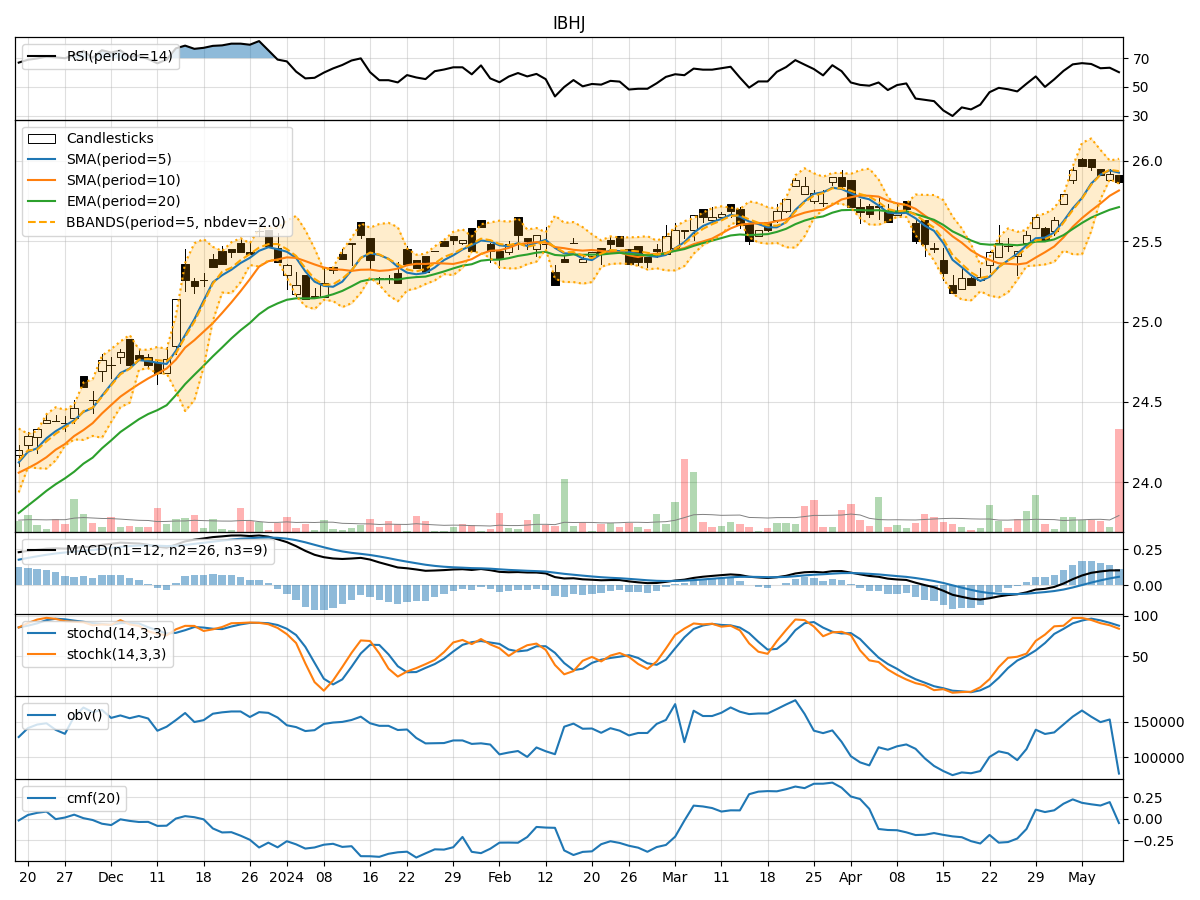
- Moving Averages (MA): The 5-day MA has been consistently above the closing prices, indicating a short-term uptrend.
- MACD: The MACD line has been above the signal line, suggesting bullish momentum.
- EMA: The EMA has been trending upwards, supporting the bullish sentiment.
Key Observation: The trend indicators point towards an upward movement in the stock price.
Momentum Indicators:
- RSI: The RSI has been fluctuating around the overbought territory, indicating strong buying pressure.
- Stochastic Oscillator: Both %K and %D have been in the overbought zone, signaling potential overvaluation.
- Williams %R: The indicator has been consistently in the oversold region, suggesting a possible reversal.
Key Observation: Momentum indicators suggest a mixed outlook, with potential for a pullback due to overbought conditions.
Volatility Indicators:
- Bollinger Bands: The stock price has been trading within the bands, indicating normal volatility.
- Bollinger %B: The %B is hovering around 0.5, suggesting equilibrium between volatility and price movement.
Key Observation: Volatility indicators imply a stable price movement with no extreme fluctuations.
Volume Indicators:
- On-Balance Volume (OBV): The OBV has shown mixed signals, with a recent decline in volume.
- Chaikin Money Flow (CMF): The CMF has been positive but trending downwards, indicating weakening buying pressure.
Key Observation: Volume indicators reflect a weakening interest from investors.
Conclusion:
Based on the analysis of trend, momentum, volatility, and volume indicators, the next few days' possible stock price movement for IBHJ is likely to be sideways to slightly bearish. While the trend indicators suggest an upward bias, the momentum indicators indicate a potential pullback due to overbought conditions. Volatility remains stable, but volume indicators show a decrease in buying interest. Therefore, investors should exercise caution and consider potential profit-taking or a short-term correction in the stock price.