Technical Analysis of IBIA 2024-05-10
Overview:
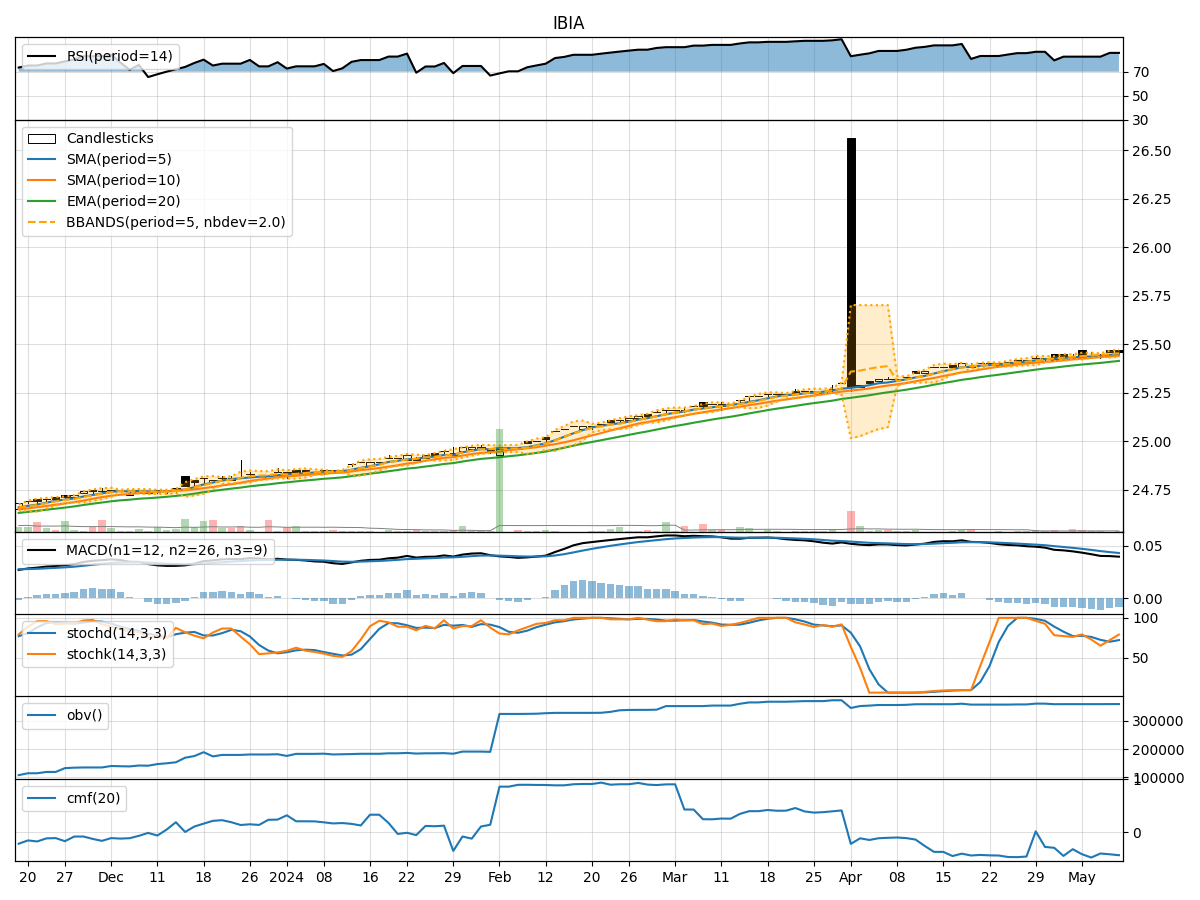
In analyzing the technical indicators for IBIA stock over the last 5 days, we will delve into the trend, momentum, volatility, and volume indicators to provide a comprehensive outlook on the possible future stock price movement. By examining these key indicators, we aim to offer valuable insights and predictions for the upcoming trading days.
Trend Indicators:
- Moving Averages (MA): The 5-day moving average has been consistently above both the simple moving average (SMA) and exponential moving average (EMA), indicating a short-term uptrend.
- MACD: The MACD line has been positive, suggesting bullish momentum in the stock price.
- MACD Histogram: The MACD histogram has been decreasing but remains above the signal line, indicating a potential slowdown in the uptrend.
Momentum Indicators:
- RSI: The Relative Strength Index (RSI) has been in the overbought territory, indicating a strong bullish momentum.
- Stochastic Oscillator: Both %K and %D have been in the overbought zone, suggesting a potential reversal or consolidation.
- Williams %R: The Williams %R is also in the overbought region, signaling a possible pullback in the stock price.
Volatility Indicators:
- Bollinger Bands: The stock price has been trading within the upper Bollinger Band, indicating an overbought condition.
- Bollinger Band Width: The Band Width has been expanding, suggesting increased volatility in the stock price.
Volume Indicators:
- On-Balance Volume (OBV): The OBV has been relatively flat, indicating a lack of significant buying or selling pressure.
- Chaikin Money Flow (CMF): The CMF has been negative, reflecting a bearish money flow in the stock.
Key Observations and Opinions:
- The trend indicators suggest a short-term uptrend in the stock price, supported by the positive MACD and moving averages.
- Momentum indicators indicate an overbought condition, with RSI, Stochastic, and Williams %R signaling a potential reversal or consolidation.
- Volatility indicators point to an increased volatility environment, as seen in the expanding Bollinger Band Width.
- Volume indicators show a lack of strong buying or selling pressure, with OBV and CMF reflecting a neutral to bearish sentiment.
Conclusion:
Based on the analysis of the technical indicators, the next few days for IBIA stock could see a potential consolidation or pullback in the stock price. The overbought momentum signals and lack of significant buying pressure suggest a possible period of sideways movement or a minor correction. Traders and investors should exercise caution and consider waiting for clearer signals before making trading decisions.