Technical Analysis of IBID 2024-05-10
Overview:
In analyzing the technical indicators for IBID stock over the last 5 days, we will delve into the trends, momentum, volatility, and volume indicators to provide a comprehensive outlook on the possible stock price movement in the coming days. By examining these key aspects, we aim to offer valuable insights and predictions to guide your investment decisions.
Trend Indicators:
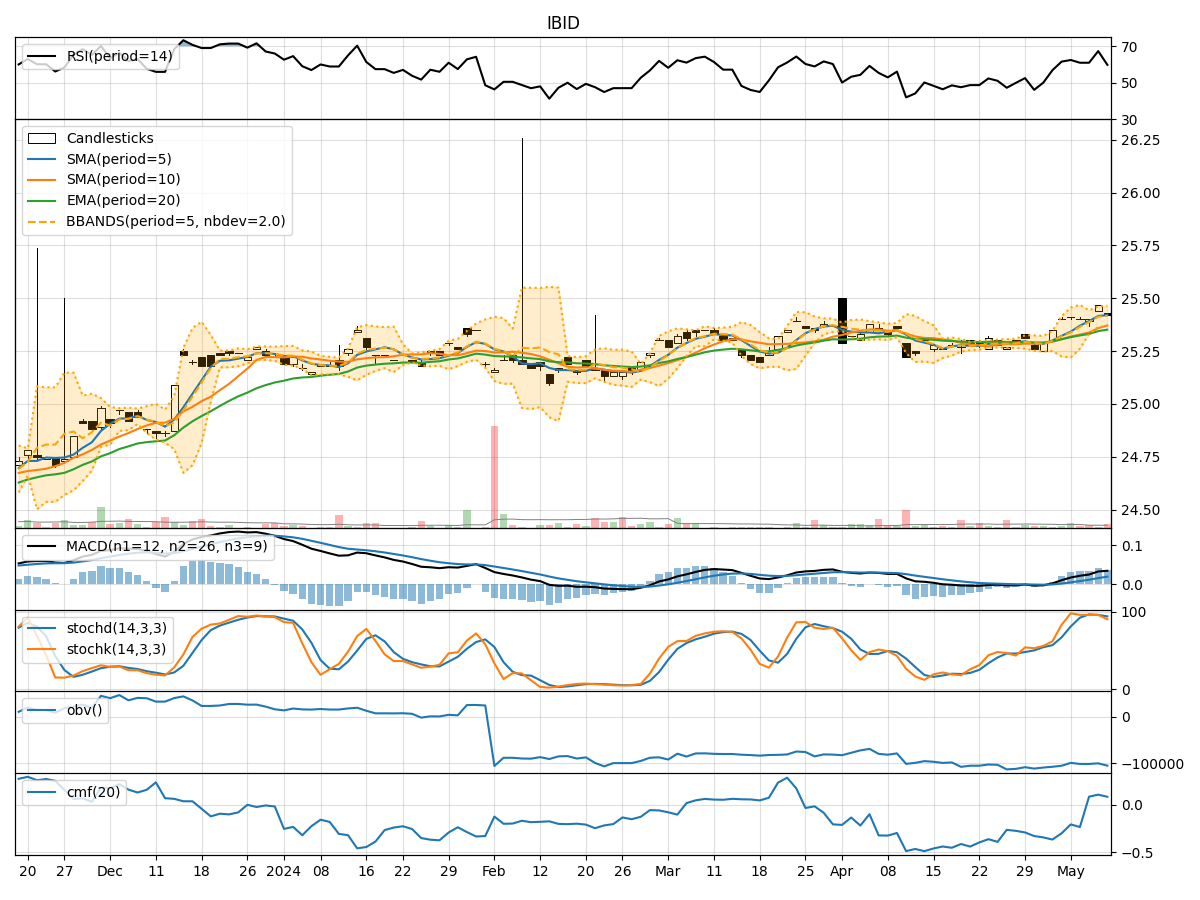
- Moving Averages (MA): The 5-day Moving Average (MA) has been consistently above the Simple Moving Average (SMA) and Exponential Moving Average (EMA), indicating a bullish trend.
- MACD: The MACD line has been consistently above the signal line, with both lines showing an upward trend, suggesting bullish momentum.
- Conclusion: The trend indicators point towards an upward movement in the stock price.
Momentum Indicators:
- RSI: The Relative Strength Index (RSI) has been fluctuating but generally staying above 50, indicating bullish momentum.
- Stochastic Oscillator: Both %K and %D have been relatively high, suggesting strong buying pressure.
- Conclusion: Momentum indicators support a bullish outlook for the stock.
Volatility Indicators:
- Bollinger Bands: The stock price has been trading within the Bollinger Bands, with the bands narrowing, indicating decreasing volatility.
- Conclusion: Volatility indicators suggest a sideways or consolidation phase in the stock price.
Volume Indicators:
- On-Balance Volume (OBV): The OBV has shown mixed signals, with some days seeing negative volume, indicating profit-taking.
- Chaikin Money Flow (CMF): The CMF has been fluctuating around the zero line, suggesting a balance between buying and selling pressure.
- Conclusion: Volume indicators are inconclusive, indicating a neutral stance.
Overall Conclusion:
Based on the analysis of trend, momentum, volatility, and volume indicators, the stock is likely to experience upward movement in the coming days, supported by strong trend and momentum signals. However, the narrowing Bollinger Bands and mixed volume indicators suggest a possible consolidation phase before a potential breakout. It is essential to monitor the price action closely for confirmation of the anticipated upward movement.
Recommendation:
Considering the overall bullish sentiment from trend and momentum indicators, it may be a good opportunity to consider a long position in IBID stock. However, it is crucial to set stop-loss orders to manage risk effectively, especially during periods of increased volatility or consolidation. Additionally, staying informed about any market developments or news that could impact the stock price is advisable to make well-informed investment decisions.