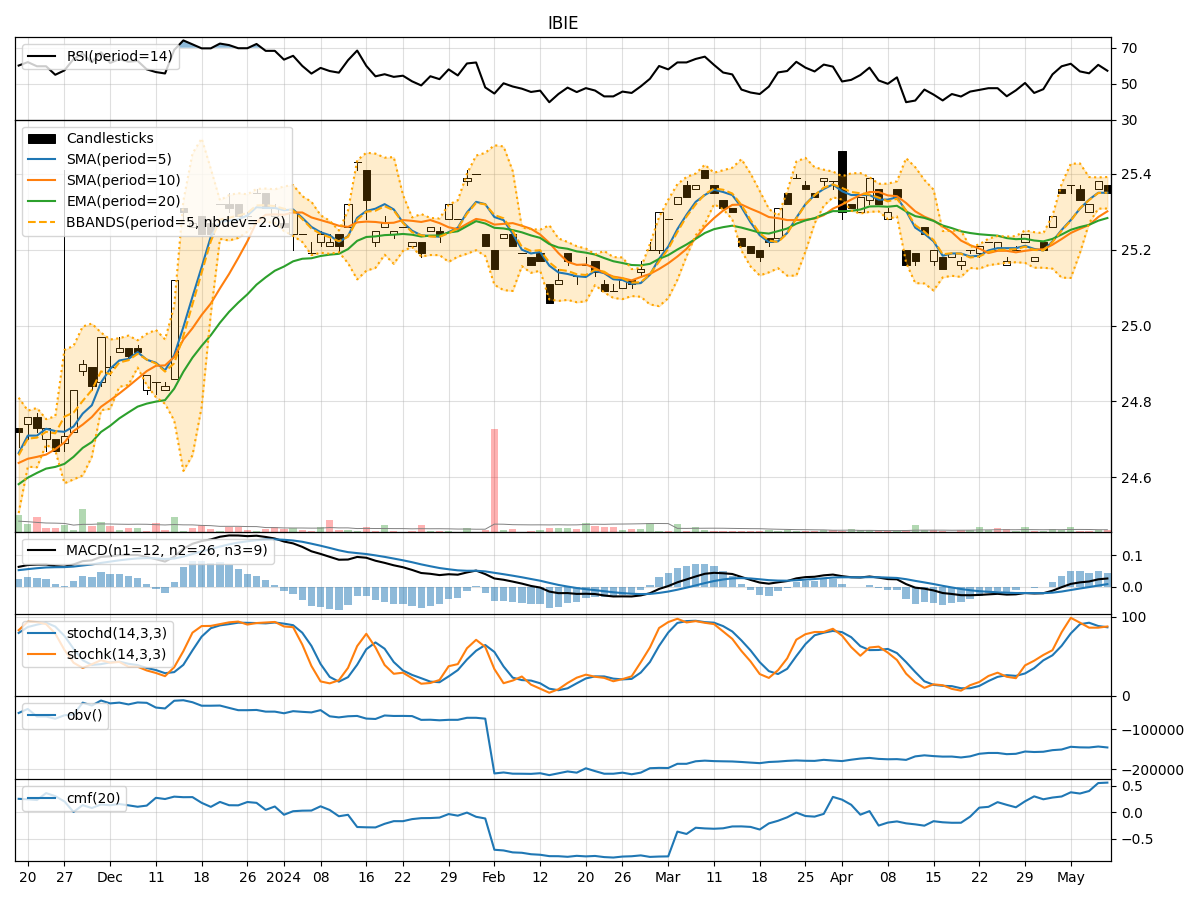
Technical Analysis of IBIE 2024-05-10
Overview:
In analyzing the technical indicators for IBIE stock over the last 5 days, we will delve into the trend, momentum, volatility, and volume indicators to provide a comprehensive outlook on the possible stock price movement in the coming days. By examining key metrics such as moving averages, MACD, RSI, Bollinger Bands, and OBV, we aim to offer valuable insights and predictions for potential price trends.
Trend Indicators:
- Moving Averages (MA): The 5-day MA has been consistently above the closing prices, indicating a short-term uptrend.
- MACD: The MACD line has been above the signal line, suggesting bullish momentum.
- EMA: The EMA has been trending upwards, supporting the bullish sentiment.
Momentum Indicators:
- RSI: The RSI has been fluctuating around the 50 level, indicating a neutral stance.
- Stochastic Oscillator: Both %K and %D have been hovering in the overbought territory, signaling potential consolidation.
- Williams %R: The indicator has shown oversold conditions, hinting at a possible reversal.
Volatility Indicators:
- Bollinger Bands (BB): The bands have been narrowing, suggesting decreased volatility and a potential breakout.
Volume Indicators:
- On-Balance Volume (OBV): The OBV has shown mixed signals, reflecting indecision among market participants.
- Chaikin Money Flow (CMF): The CMF has been positive, indicating buying pressure in the market.
Key Observations:
- The trend indicators point towards a bullish sentiment in the short term.
- Momentum indicators suggest a potential consolidation phase or a minor pullback.
- Volatility indicators indicate a possible breakout in the near future.
- Volume indicators show mixed signals, reflecting uncertainty among investors.
Conclusion:
Based on the analysis of the technical indicators, the next few days' possible stock price movement for IBIE is likely to be sideways with a bullish bias. Traders should watch for a potential breakout as volatility increases, while also monitoring for any signs of a reversal in momentum indicators. It is essential to remain cautious and consider implementing risk management strategies to navigate the market uncertainties effectively.