Technical Analysis of IBLC 2024-05-10
Overview:
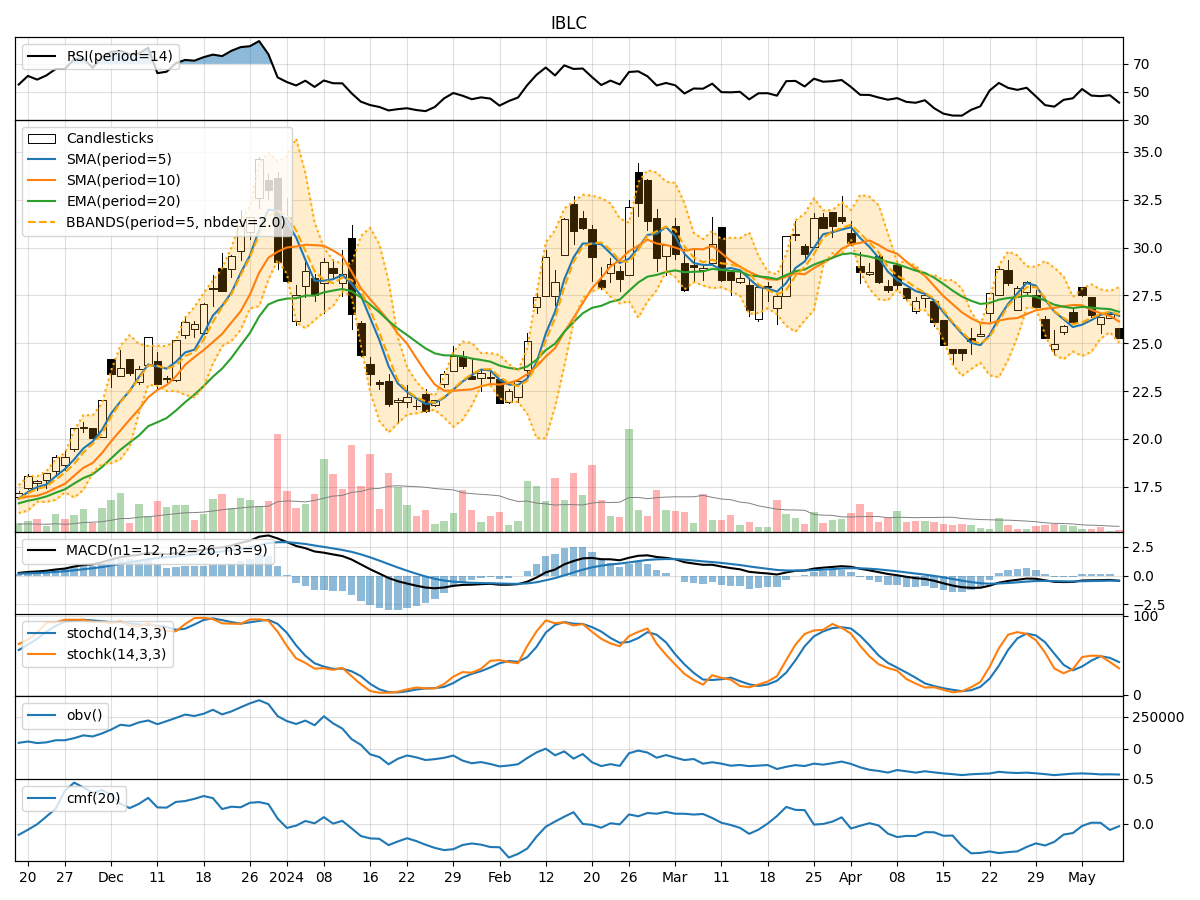
In analyzing the technical indicators for IBLC stock over the last 5 days, we will delve into the trend, momentum, volatility, and volume indicators to provide a comprehensive outlook on the possible future stock price movement. By examining these key aspects, we aim to offer valuable insights and recommendations for potential investors.
Trend Analysis:
- Moving Averages (MA): The 5-day MA has been fluctuating around the closing prices, indicating short-term price trends. The SMA(10) and EMA(20) have been relatively close to each other, suggesting stability in the medium to long-term trends.
- MACD: The MACD line has been consistently below the signal line, indicating a bearish trend. However, the MACD histogram has shown slight improvements, hinting at a potential reversal.
Momentum Analysis:
- RSI: The RSI has been hovering around the neutral zone, indicating a lack of strong momentum in either direction.
- Stochastic Oscillator: Both %K and %D have been declining, suggesting a weakening momentum.
- Williams %R: The Williams %R has been in the oversold territory, indicating a potential buying opportunity.
Volatility Analysis:
- Bollinger Bands (BB): The stock price has been trading within the bands, indicating a period of consolidation. The narrowing of the bands suggests a potential breakout in the near future.
- Bollinger %B: The %B indicator has been decreasing, signaling a decrease in volatility.
Volume Analysis:
- On-Balance Volume (OBV): The OBV has been negative, indicating selling pressure in the stock.
- Chaikin Money Flow (CMF): The CMF has been negative, suggesting a lack of buying interest in the stock.
Conclusion:
Based on the analysis of the technical indicators, the stock is currently in a bearish phase with weak momentum and negative volume indicators. The trend is showing signs of potential reversal, but the overall outlook remains bearish. The stock is likely to experience further downside movement in the next few days. Investors should exercise caution and consider waiting for more positive signals before considering any long positions.