Technical Analysis of IBMP 2024-05-10
Overview:
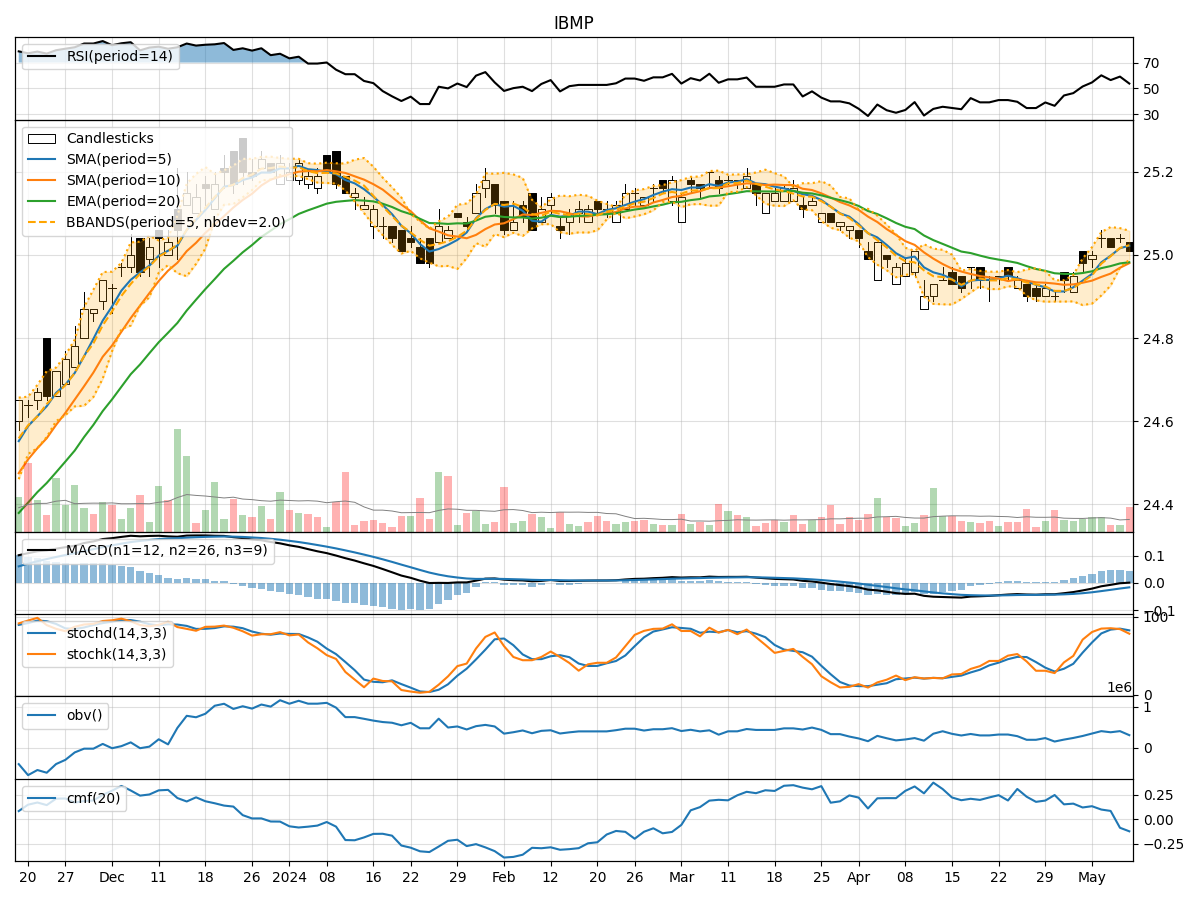
In analyzing the technical indicators for IBM stock over the last 5 days, we will delve into the trend, momentum, volatility, and volume indicators to provide a comprehensive outlook on the possible stock price movement in the coming days. By examining these key indicators, we aim to offer valuable insights and predictions for informed decision-making.
Trend Analysis:
- Moving Averages (MA): The 5-day Moving Average (MA) has been relatively stable around the closing prices, indicating a consistent trend.
- MACD: The Moving Average Convergence Divergence (MACD) has shown a slight positive trend, with the MACD line crossing above the signal line.
- EMA: The Exponential Moving Average (EMA) has been gradually increasing, suggesting a bullish trend.
Momentum Analysis:
- RSI: The Relative Strength Index (RSI) has been fluctuating around the neutral level of 50, indicating a balanced momentum.
- Stochastic Oscillator: Both %K and %D values have been oscillating within the overbought and oversold levels, reflecting a mixed momentum.
- Williams %R: The Williams %R indicator has been in the oversold territory, signaling a potential reversal.
Volatility Analysis:
- Bollinger Bands (BB): The Bollinger Bands have been narrowing, indicating decreasing volatility in the stock price.
- BB% (Bollinger Band %B): The %B indicator has been hovering around the middle band, suggesting a period of consolidation.
Volume Analysis:
- On-Balance Volume (OBV): The OBV indicator has shown mixed signals, with fluctuations in volume accumulation.
- Chaikin Money Flow (CMF): The CMF has been negative, indicating selling pressure in the market.
Key Observations:
- The trend indicators suggest a bullish sentiment with the EMA showing an upward trajectory.
- Momentum indicators reflect a mixed sentiment with RSI around the neutral level and stochastic oscillating.
- Volatility indicators point towards decreasing volatility and a period of consolidation.
- Volume indicators show mixed signals with OBV fluctuating and CMF indicating selling pressure.
Conclusion:
Based on the analysis of the technical indicators, the stock price of IBM is likely to experience a period of consolidation in the coming days. The bullish trend indicated by the EMA and MACD may be limited by the mixed momentum signals and decreasing volatility. Investors should closely monitor key support and resistance levels for potential breakout or breakdown scenarios. It is advisable to exercise caution and wait for clearer signals before making significant trading decisions.