Technical Analysis of IBOT 2024-05-10
Overview:
In analyzing the technical indicators for IBOT stock over the last 5 days, we will delve into the trend, momentum, volatility, and volume indicators to provide a comprehensive outlook on the possible stock price movement in the coming days. By examining these key indicators, we aim to offer valuable insights and predictions for potential investors.
Trend Analysis:
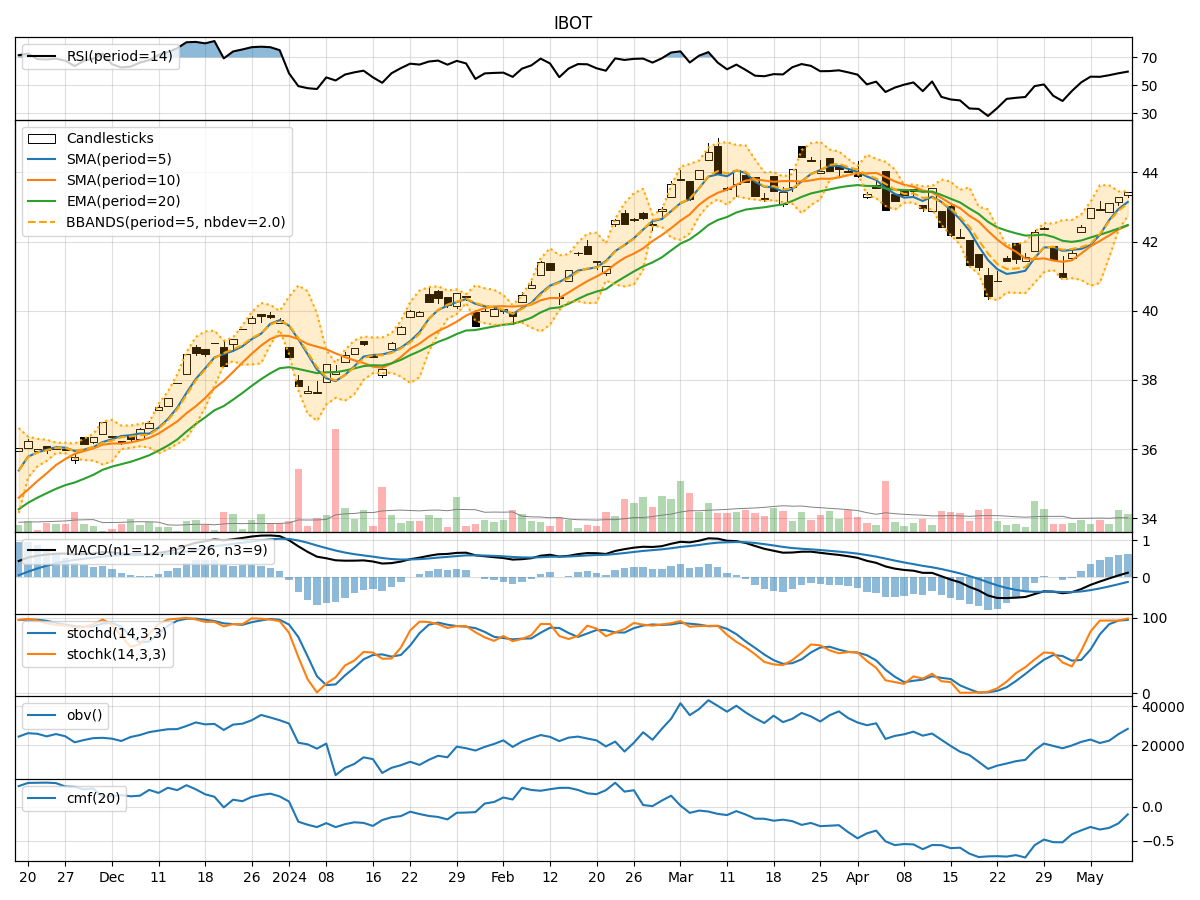
- Moving Averages (MA): The 5-day Moving Average (MA) has been consistently increasing, indicating a bullish trend in the short term.
- MACD: The MACD line has been positive and rising, suggesting upward momentum in the stock price.
- RSI: The Relative Strength Index (RSI) has been increasing, showing strengthening buying pressure.
Momentum Analysis:
- Stochastic Oscillator: Both %K and %D have been in the overbought zone, indicating a potential reversal or consolidation.
- Williams %R: The Williams %R is at or near oversold levels, suggesting a possible buying opportunity.
Volatility Analysis:
- Bollinger Bands (BB): The stock price has been trading within the upper Bollinger Band, indicating an overbought condition.
- BB% (Bollinger Band %B): The BB% has been above 0.8, signaling a potential reversal or pullback.
Volume Analysis:
- On-Balance Volume (OBV): The OBV has been fluctuating, indicating indecision among investors.
- Chaikin Money Flow (CMF): The CMF has been negative, suggesting selling pressure in the stock.
Key Observations:
- The trend indicators suggest a bullish outlook in the short term.
- Momentum indicators show a potential reversal or consolidation in the stock price.
- Volatility indicators point towards a possible pullback or correction.
- Volume indicators indicate indecision and selling pressure among investors.
Conclusion:
Based on the analysis of the technical indicators, the next few days' possible stock price movement for IBOT is likely to experience a short-term consolidation or pullback. Investors should exercise caution and consider waiting for a clearer trend confirmation before making any significant trading decisions. The stock may enter a period of sideways movement before potentially resuming its upward trajectory. It is advisable to closely monitor key support and resistance levels for better entry and exit points.