Technical Analysis of IBRN 2024-05-10
Overview:
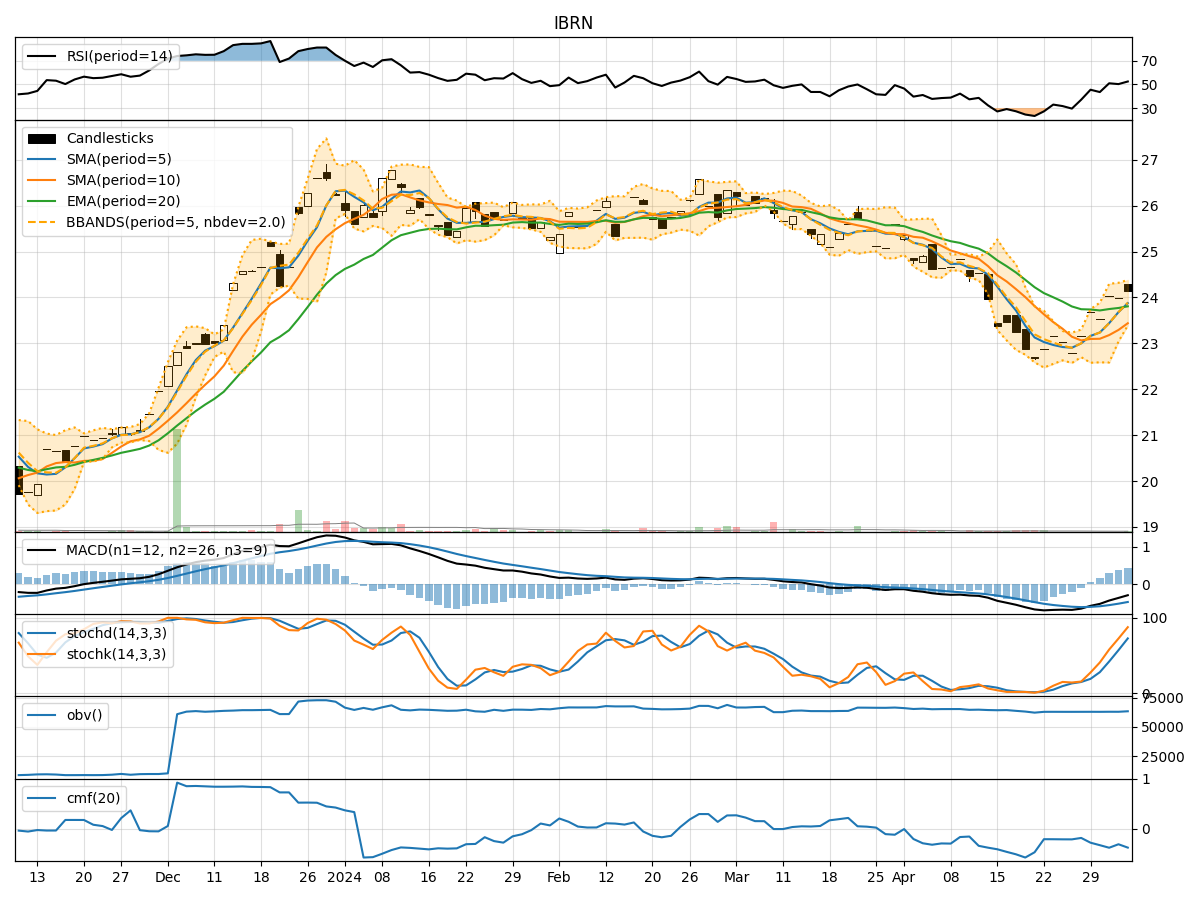
In analyzing the technical indicators for IBRN over the last 5 days, we will delve into the trend, momentum, volatility, and volume indicators to provide a comprehensive outlook on the possible stock price movement. By examining these key indicators, we aim to offer valuable insights and predictions for the upcoming days.
Trend Analysis:
- Moving Averages (MA): The 5-day Moving Average (MA) has been fluctuating around the closing prices, indicating short-term price trends. The Simple Moving Average (SMA) and Exponential Moving Average (EMA) show a slight downward trend, suggesting potential bearish sentiment.
- MACD: The Moving Average Convergence Divergence (MACD) has been negative, with the MACD line below the signal line. This indicates a bearish momentum in the stock price.
- Conclusion: The trend indicators suggest a bearish outlook for IBRN in the near term.
Momentum Analysis:
- RSI: The Relative Strength Index (RSI) has been hovering around 50, indicating a neutral momentum with no clear overbought or oversold conditions.
- Stochastic Oscillator: Both %K and %D values have been declining, signaling a weakening momentum.
- Williams %R: The Williams %R is in the oversold territory, suggesting a potential reversal or consolidation.
- Conclusion: The momentum indicators point towards a neutral to bearish sentiment for IBRN.
Volatility Analysis:
- Bollinger Bands (BB): The Bollinger Bands show a narrowing range, indicating decreasing volatility. The bands are contracting, suggesting a potential breakout or significant price movement.
- Conclusion: The volatility indicators imply a potential breakout or significant price movement in the near future for IBRN.
Volume Analysis:
- On-Balance Volume (OBV): The OBV has been declining, indicating selling pressure and a bearish volume trend.
- Chaikin Money Flow (CMF): The CMF has been negative, reflecting a lack of buying interest and potential bearish sentiment.
- Conclusion: The volume indicators suggest a bearish volume trend for IBRN.
Overall Conclusion:
Based on the analysis of trend, momentum, volatility, and volume indicators, the overall outlook for IBRN in the next few days is bearish. The trend indicators, momentum signals, and volume analysis all point towards a potential downward movement in the stock price. However, the volatility indicators hint at a possible breakout or significant price movement, which could introduce some uncertainty in the short term.
Key Points:
- Trend: Bearish
- Momentum: Neutral to Bearish
- Volatility: Potential Breakout
- Volume: Bearish
Recommendation:
Considering the overall bearish sentiment in the technical indicators, investors should exercise caution when trading IBRN in the upcoming days. It is advisable to closely monitor the price action, especially around the narrowing Bollinger Bands, for potential entry or exit points. Traders should consider implementing risk management strategies to mitigate potential losses in a volatile market environment.
Disclaimer:
This analysis is based solely on technical indicators and historical data. Market dynamics can change rapidly, and unforeseen events may impact stock prices. It is essential to conduct thorough research, consider fundamental factors, and seek professional advice before making any investment decisions.