Technical Analysis of IBTG 2024-05-10
Overview:
In analyzing the technical indicators for IBTG stock over the last 5 days, we will delve into the trend, momentum, volatility, and volume indicators to provide a comprehensive outlook on the possible stock price movement in the coming days. By examining these key indicators, we aim to offer valuable insights and predictions for potential investors.
Trend Indicators:
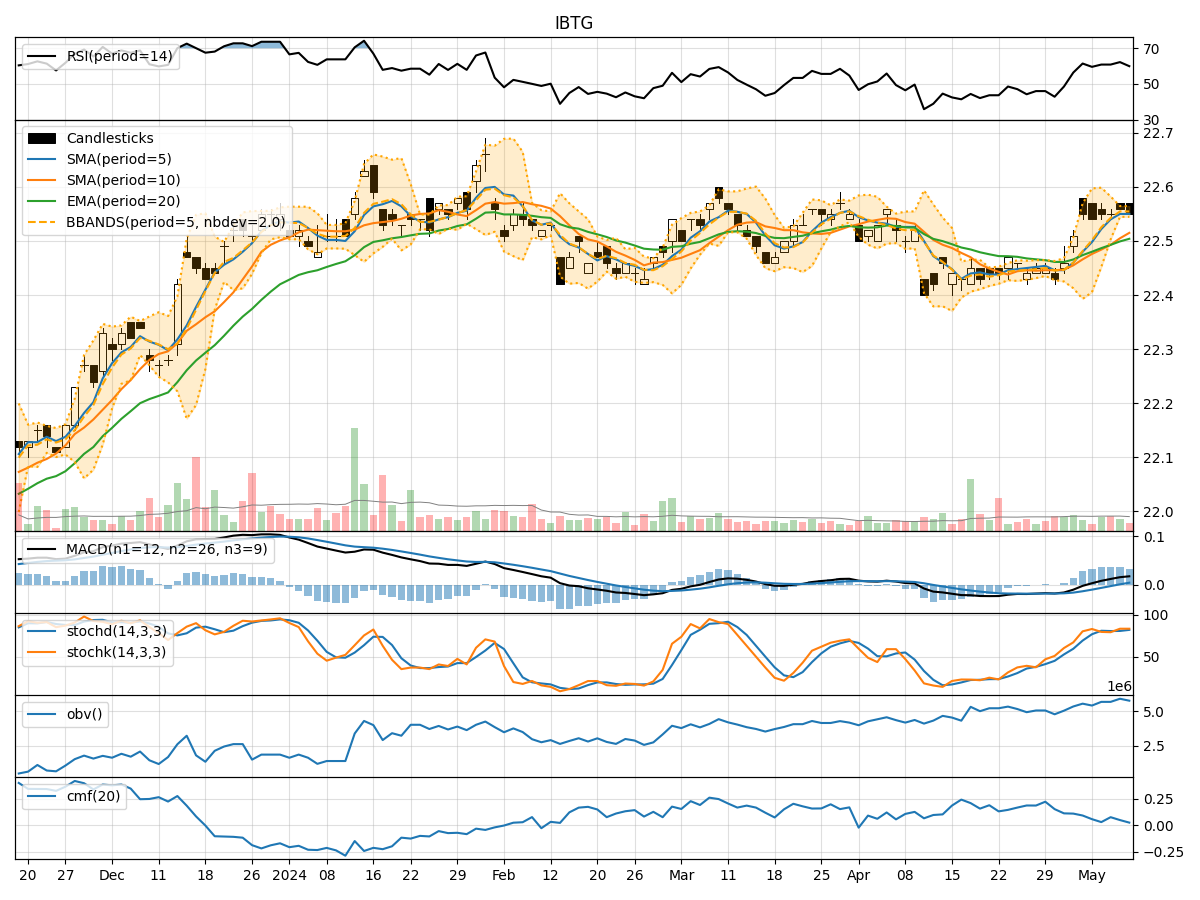
- Moving Averages (MA): The 5-day MA has been consistently above the 10-day SMA, indicating a short-term bullish trend. The EMA(20) has shown a slight upward trend, suggesting positive momentum.
- MACD: The MACD line has been above the signal line, with the MACD histogram showing a positive trend, indicating bullish momentum.
Momentum Indicators:
- RSI: The RSI has been hovering around the 60-65 range, indicating a neutral to slightly bullish momentum.
- Stochastic Oscillator: Both %K and %D have been in the overbought territory, suggesting a potential reversal or consolidation.
- Williams %R: The Williams %R has been fluctuating around the oversold region, indicating a mixed sentiment.
Volatility Indicators:
- Bollinger Bands: The stock price has been trading within the Bollinger Bands, with the bands narrowing, suggesting a period of consolidation.
- Bollinger %B: The %B indicator has been fluctuating around the midline, indicating a balanced market sentiment.
Volume Indicators:
- On-Balance Volume (OBV): The OBV has shown a slight increase, indicating some accumulation by investors.
- Chaikin Money Flow (CMF): The CMF has been positive but relatively flat, suggesting a neutral sentiment towards the stock.
Key Observations:
- The trend indicators point towards a bullish bias in the short term, supported by the moving averages and MACD.
- Momentum indicators show a mixed sentiment, with the RSI indicating a slightly bullish momentum while the stochastic oscillator and Williams %R suggest a potential reversal.
- Volatility indicators signal a period of consolidation, with the Bollinger Bands narrowing and %B hovering around the midline.
- Volume indicators reflect a neutral sentiment, with OBV showing a slight increase but CMF remaining relatively flat.
Conclusion:
Based on the analysis of the technical indicators, the next few days for IBTG stock are likely to see sideways movement with a slight bullish bias. Investors should monitor the stochastic oscillator for potential reversal signals and the Bollinger Bands for any breakout or breakdown patterns. It is advisable to wait for clearer signals before making significant trading decisions.