Technical Analysis of IBTH 2024-05-10
Overview:
In analyzing the technical indicators for IBTH stock over the last 5 days, we will delve into the trend, momentum, volatility, and volume indicators to provide a comprehensive outlook on the possible future stock price movement. By examining these key indicators, we aim to offer valuable insights and recommendations for potential investors.
Trend Analysis:
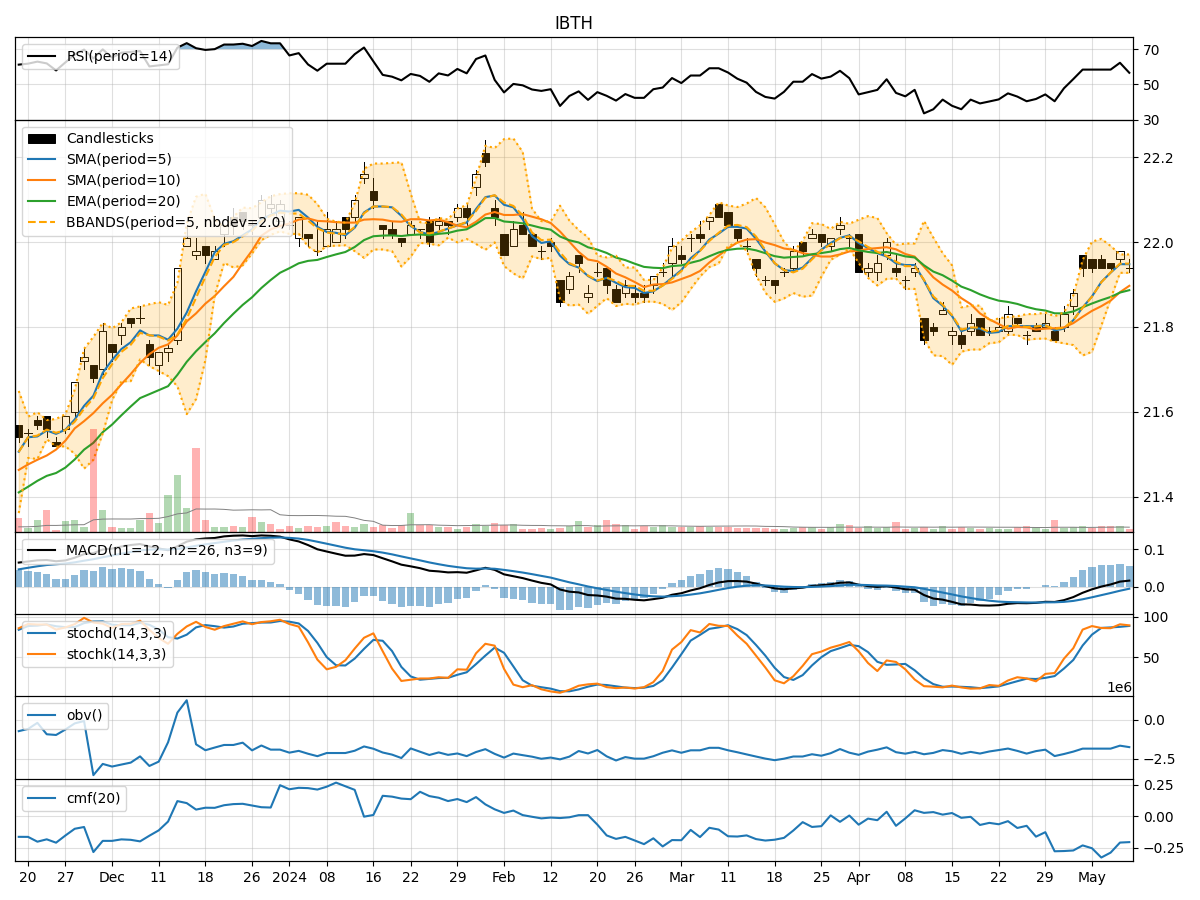
- Moving Averages (MA): The 5-day Moving Average (MA) has been relatively stable around the closing price, indicating a lack of significant trend direction.
- MACD: The MACD line has been consistently positive, suggesting a bullish momentum in the short term.
- EMA: The Exponential Moving Average (EMA) has shown a slight upward trend, indicating a potential bullish sentiment.
Momentum Analysis:
- RSI: The Relative Strength Index (RSI) has been fluctuating around the neutral zone, indicating a balanced momentum between buying and selling pressure.
- Stochastic Oscillator: Both %K and %D have been in the overbought territory, suggesting a potential reversal or consolidation phase.
- Williams %R: The Williams %R indicator has been hovering in the oversold region, signaling a possible buying opportunity.
Volatility Analysis:
- Bollinger Bands: The Bollinger Bands have been relatively narrow, indicating low volatility and a potential period of consolidation.
- Bollinger %B: The %B indicator has been fluctuating around the middle band, suggesting a balanced market sentiment.
Volume Analysis:
- On-Balance Volume (OBV): The OBV indicator has been relatively flat, indicating a lack of significant accumulation or distribution.
- Chaikin Money Flow (CMF): The CMF has been negative, suggesting a slight bearish pressure in the market.
Key Observations:
- The trend indicators show a potential bullish sentiment in the short term.
- Momentum indicators suggest a mixed sentiment with a possibility of a reversal or consolidation phase.
- Volatility indicators point towards a period of low volatility and potential consolidation.
- Volume indicators indicate a lack of significant buying or selling pressure.
Conclusion:
Based on the analysis of the technical indicators, the next few days for IBTH stock may see sideways movement with a slight bullish bias. Traders should exercise caution and closely monitor key support and resistance levels for potential entry or exit points. It is advisable to wait for clearer signals from the indicators before making significant trading decisions.