Technical Analysis of IBTJ 2024-05-10
Overview:
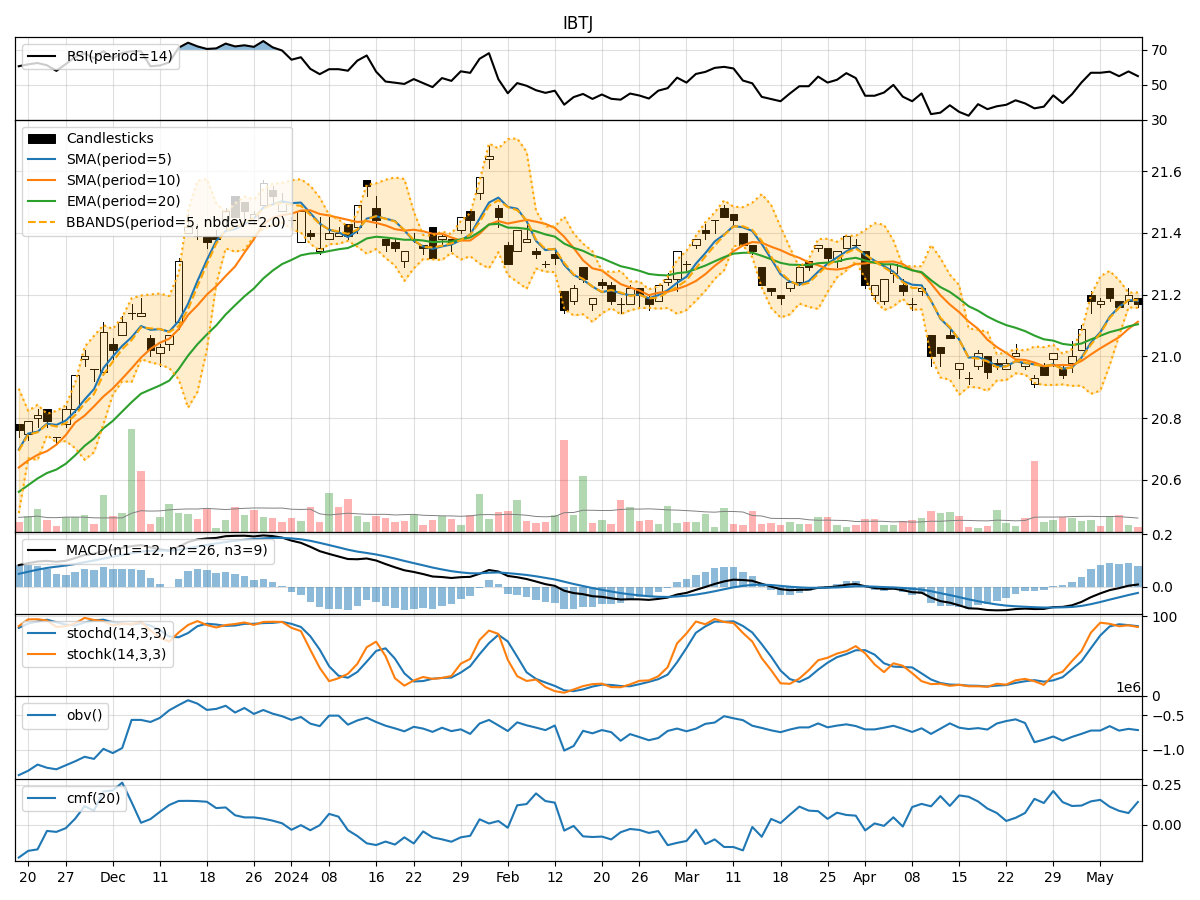
In analyzing the technical indicators for IBTJ stock over the last 5 days, we will delve into the trend, momentum, volatility, and volume indicators to provide a comprehensive outlook on the possible stock price movement in the coming days. By examining these key indicators, we aim to offer valuable insights and predictions for informed decision-making.
Trend Indicators:
- Moving Averages (MA): The 5-day MA has been consistently above the closing price, indicating a short-term uptrend.
- MACD: The MACD line has been positive, suggesting bullish momentum.
- RSI: The RSI values have been fluctuating around the overbought territory, indicating potential strength in the current uptrend.
Momentum Indicators:
- Stochastic Oscillator: The %K and %D values have been relatively high, signaling strong buying pressure.
- Williams %R: The values have been hovering in the oversold region, indicating a potential reversal to the upside.
Volatility Indicators:
- Bollinger Bands (BB): The stock price has been trading within the bands, suggesting a period of consolidation.
- BB% (Bollinger Band %B): The %B values have been fluctuating around the midline, indicating a balanced market sentiment.
Volume Indicators:
- On-Balance Volume (OBV): The OBV values have shown mixed signals, reflecting indecision among market participants.
- Chaikin Money Flow (CMF): The CMF values have been positive, indicating buying pressure in the market.
Key Observations:
- The trend indicators suggest a bullish bias in the short term.
- Momentum indicators point towards strong buying pressure and a potential reversal.
- Volatility indicators indicate a period of consolidation.
- Volume indicators show mixed signals with a slight buying bias.
Conclusion:
Based on the analysis of the technical indicators, the next few days for IBTJ stock are likely to see continued upward movement with a bullish bias. The strong momentum and positive trend indicators support this outlook, while the consolidation phase indicated by volatility indicators may lead to a temporary pause in the uptrend. Traders and investors should consider capitalizing on potential buying opportunities during any pullbacks within the overall bullish trend.