Technical Analysis of IBTM 2024-05-10
Overview:
In analyzing the technical indicators for IBTM stock over the last 5 days, we will delve into the trend, momentum, volatility, and volume indicators to provide a comprehensive outlook on the possible future stock price movement. By examining these key indicators, we aim to offer valuable insights and predictions for the upcoming trading days.
Trend Analysis:
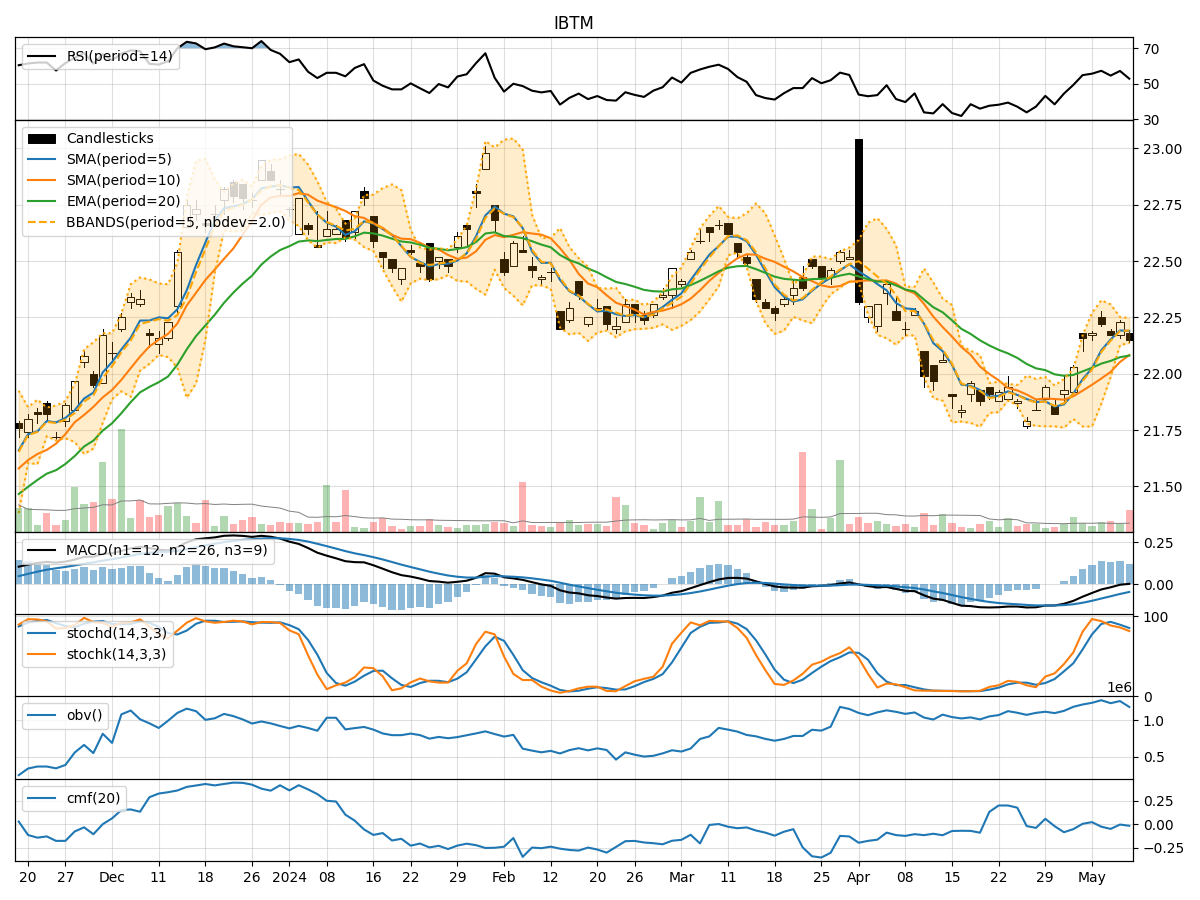
- Moving Averages (MA): The 5-day Moving Average (MA) has been relatively stable around the closing prices, indicating a consistent trend.
- MACD and Signal Line: The MACD has shown a slight positive divergence, with the MACD line moving above the signal line in recent days.
- Relative Strength Index (RSI): The RSI has been fluctuating around the neutral level of 50, suggesting a balanced momentum in the stock.
Key Observation: The trend indicators suggest a neutral to slightly positive outlook for IBTM stock in the short term.
Momentum Analysis:
- Stochastic Oscillator: The Stochastic Oscillator has been gradually decreasing but remains in the overbought territory, indicating a potential reversal in momentum.
- Williams %R (WillR): The Williams %R has been consistently in the oversold region, signaling a possible buying opportunity.
Key Observation: Momentum indicators point towards a potential reversal or consolidation phase in the stock's momentum.
Volatility Analysis:
- Bollinger Bands (BB): The Bollinger Bands have been narrowing, indicating decreasing volatility in the stock.
- Bollinger Band %B (BBP): The %B indicator suggests that the stock price is currently trading close to the lower band.
Key Observation: Volatility indicators signal a period of low volatility and a potential breakout in the near future.
Volume Analysis:
- On-Balance Volume (OBV): The OBV has shown mixed signals, fluctuating without a clear trend.
- Chaikin Money Flow (CMF): The CMF has been negative, indicating selling pressure in the stock.
Key Observation: Volume indicators reflect uncertainty and lack of strong buying interest in the stock.
Conclusion:
Based on the analysis of trend, momentum, volatility, and volume indicators, the stock price of IBTM is likely to experience a period of consolidation in the upcoming trading days. The neutral trend, mixed momentum signals, low volatility, and lack of strong volume support suggest a sideways movement or a slight downward bias in the short term.
Recommendation: Traders should exercise caution and wait for clearer signals before taking significant positions. It is advisable to closely monitor key support and resistance levels for potential entry or exit points.
Overall Outlook: Sideways with a slight bearish bias in the near term for IBTM stock.