Technical Analysis of IBTO 2024-05-10
Overview:
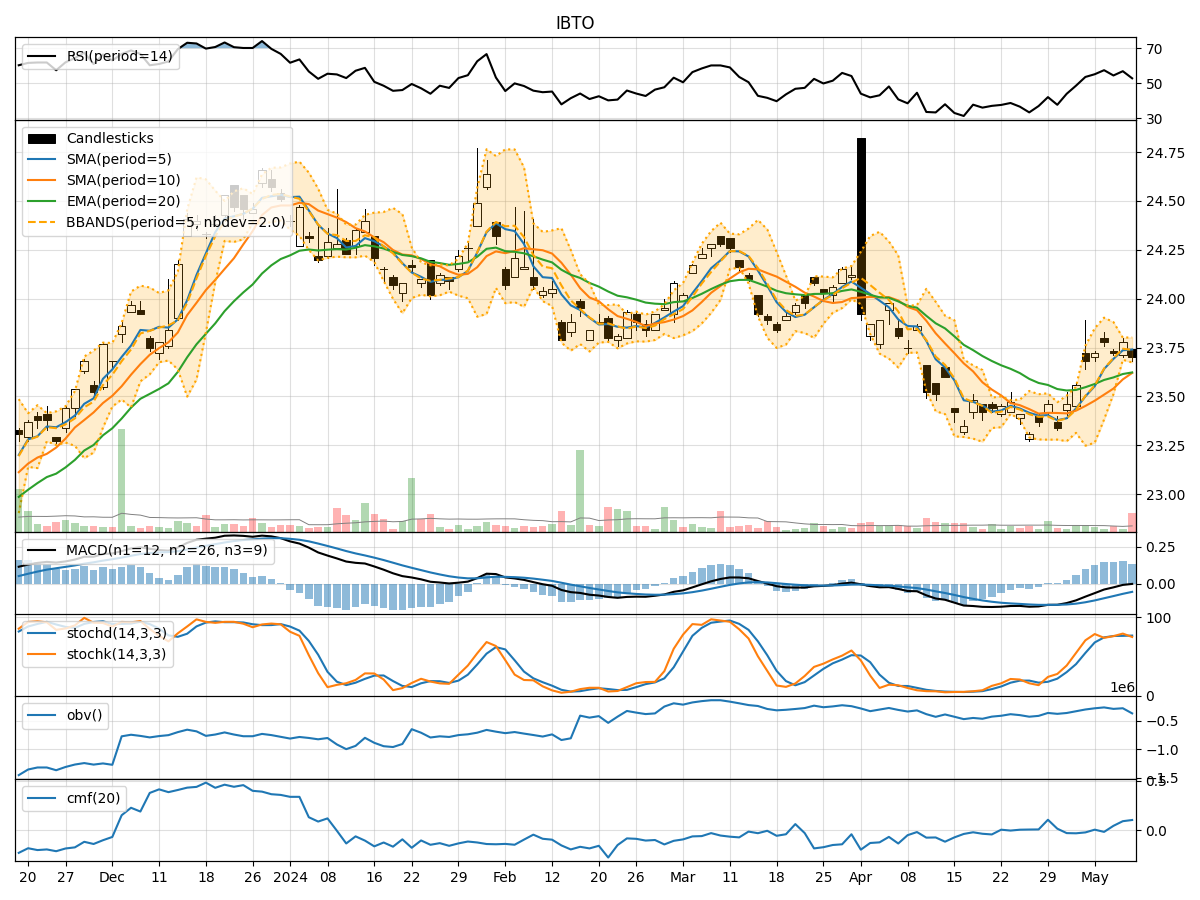
In the last 5 trading days, IBTO stock has shown mixed signals across various technical indicators. The trend indicators suggest a relatively stable price movement, with the Moving Average Convergence Divergence (MACD) showing a slight positive momentum. Momentum indicators indicate a neutral to slightly bullish sentiment, while volatility indicators show a narrowing Bollinger Bands, indicating potential consolidation. Volume indicators suggest a positive trend in On-Balance Volume (OBV) and Chaikin Money Flow (CMF).
Trend Indicators:
- Moving Averages (MA) show a consistent uptrend, with the 5-day MA above the 10-day Simple Moving Average (SMA).
- Exponential Moving Average (EMA) is also trending slightly upwards.
- MACD line is slightly positive, indicating a potential bullish momentum.
- MACD Histogram is decreasing but still above the signal line, suggesting a weakening bullish momentum.
Momentum Indicators:
- Relative Strength Index (RSI) is in the neutral zone, indicating neither overbought nor oversold conditions.
- Stochastic Oscillator shows a mixed signal, with %K above %D but both in the overbought territory.
- Williams %R is in the oversold region, suggesting a potential reversal.
Volatility Indicators:
- Bollinger Bands are narrowing, indicating decreasing volatility and a potential period of consolidation.
- The %B indicator is hovering around the midline, suggesting a balanced market sentiment.
Volume Indicators:
- On-Balance Volume (OBV) is showing a positive trend, indicating accumulation by investors.
- Chaikin Money Flow (CMF) is also positive, reflecting buying pressure in the stock.
Conclusion:
Based on the analysis of the technical indicators, the next few days for IBTO stock are likely to see sideways movement with a slight bullish bias. The trend indicators suggest a stable price movement, supported by a positive MACD. Momentum indicators indicate a neutral to slightly bullish sentiment, while volatility indicators point towards a period of consolidation. The positive trends in OBV and CMF also support the potential for a slight bullish bias in the stock price.
Key Conclusion: The stock is likely to experience sideways consolidation with a slight bullish bias in the next few days. Traders may consider monitoring key support and resistance levels for potential entry and exit points.