Technical Analysis of ICAP 2024-05-10
Overview:
In analyzing the technical indicators for ICAP over the last 5 days, we will delve into the trend, momentum, volatility, and volume indicators to provide a comprehensive outlook on the possible stock price movement in the coming days. By examining these key aspects, we aim to offer valuable insights and predictions to guide your investment decisions.
Trend Indicators:
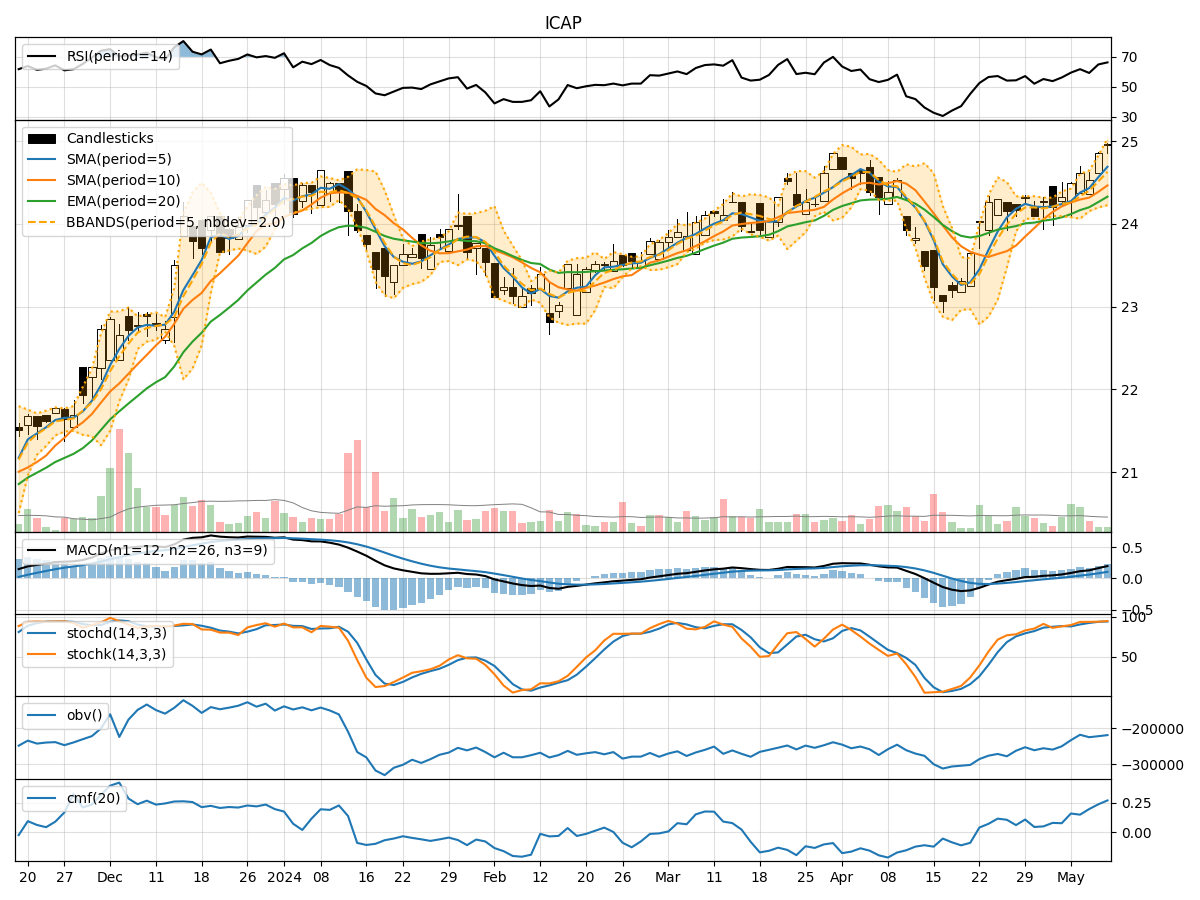
- Moving Averages (MA): The 5-day moving average has been consistently above the simple moving average (SMA) and exponential moving average (EMA), indicating a bullish trend.
- MACD: The MACD line has been consistently above the signal line, with both lines showing an upward trend, suggesting bullish momentum.
- MACD Histogram: The histogram has been increasing over the past 5 days, indicating strengthening bullish momentum.
Momentum Indicators:
- RSI: The Relative Strength Index (RSI) has been trending upwards and is currently in the overbought territory, suggesting a strong bullish momentum.
- Stochastic Oscillator: Both %K and %D lines of the Stochastic Oscillator are in the overbought zone, indicating a potential reversal or consolidation.
- Williams %R: The Williams %R is in the oversold region, signaling a potential reversal to the upside.
Volatility Indicators:
- Bollinger Bands: The stock price has been trading within the Bollinger Bands, with the bands widening slightly, indicating increased volatility.
- Bollinger %B: The %B indicator is below 1, suggesting the stock is trading below the upper Bollinger Band, potentially indicating a pullback or consolidation.
Volume Indicators:
- On-Balance Volume (OBV): The OBV has been trending upwards, indicating accumulation by investors.
- Chaikin Money Flow (CMF): The CMF is positive and has been increasing, suggesting buying pressure in the stock.
Conclusion:
Based on the analysis of the technical indicators, the stock of ICAP is currently exhibiting strong bullish momentum, supported by the trend and volume indicators. However, the overbought conditions in the momentum indicators and the potential reversal signals in the Stochastic Oscillator and Williams %R indicate a possible short-term correction or consolidation. The volatility indicators suggest that the stock may experience increased price fluctuations in the coming days.
Recommendation:
- Short-Term: The stock may experience a short-term correction or consolidation due to overbought conditions.
- Long-Term: The overall trend remains bullish, and any pullback could present a buying opportunity for long-term investors.
- Risk Management: Consider setting stop-loss levels to protect gains in case of a sudden reversal.
Key Conclusion:
The stock of ICAP is currently in an upward trend with bullish momentum, but caution is advised due to potential overbought conditions and signs of reversal in some momentum indicators. Investors should monitor the stock closely for potential entry or exit points based on the evolving market dynamics.