Technical Analysis of ICF 2024-05-10
Overview:
In the last 5 trading days, the stock price of ICF has shown some fluctuations, with a mix of positive and negative movements. By analyzing various technical indicators such as trend, momentum, volatility, and volume, we can gain insights into the possible future price movement of the stock.
Trend Analysis:
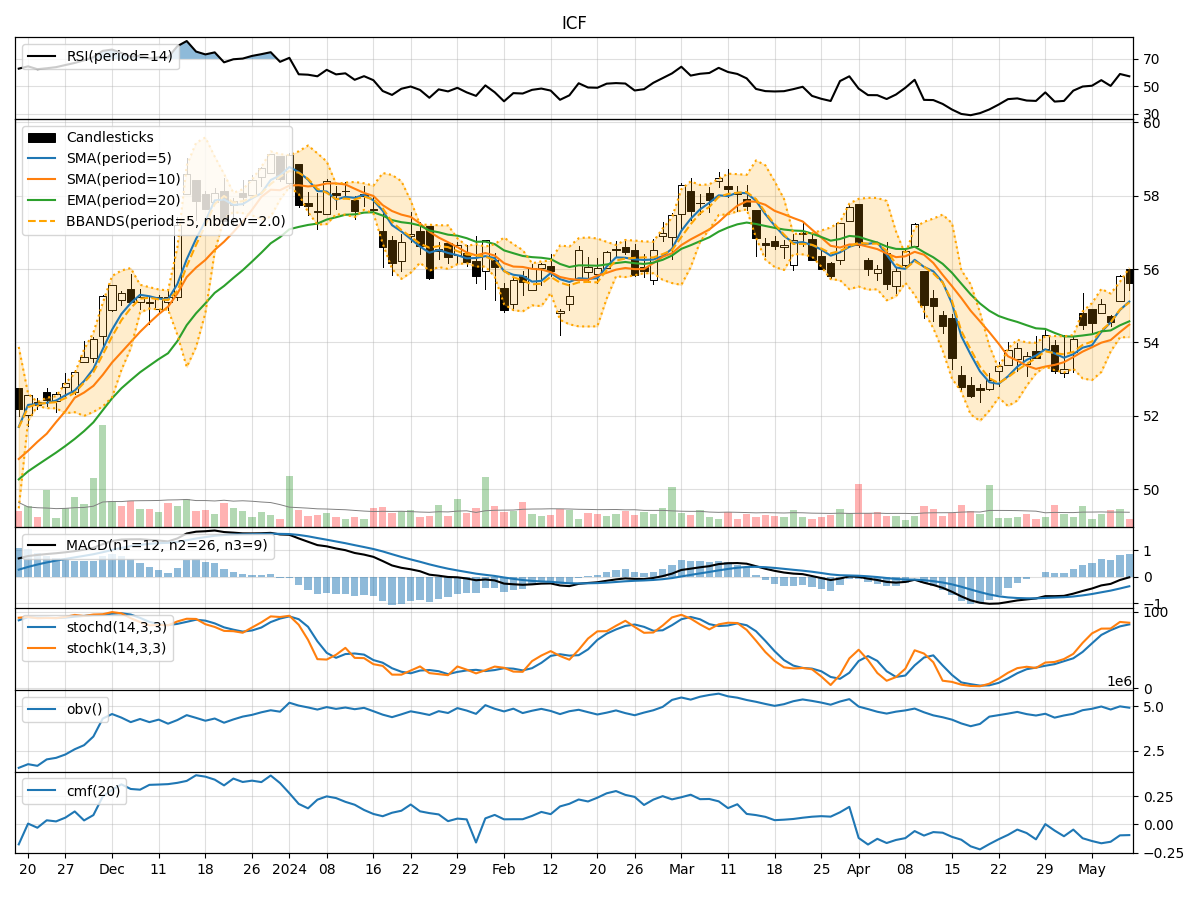
- Moving Averages (MA): The 5-day Moving Average (MA) has been trending upwards, indicating a short-term positive momentum in the stock price.
- MACD: The Moving Average Convergence Divergence (MACD) has been consistently negative but showing signs of convergence towards the signal line, suggesting a potential reversal in the downtrend.
Momentum Analysis:
- RSI: The Relative Strength Index (RSI) has been fluctuating around the neutral zone, indicating a lack of strong momentum in either direction.
- Stochastic Oscillator: Both %K and %D values have been in the overbought territory, suggesting a potential reversal or consolidation phase.
Volatility Analysis:
- Bollinger Bands (BB): The Bollinger Bands have been narrowing, indicating decreasing volatility in the stock price.
- Bollinger Band %B: The %B value has been fluctuating around 0.5, indicating the stock price is trading around the middle band.
Volume Analysis:
- On-Balance Volume (OBV): The OBV has shown mixed movements, indicating indecision among investors regarding the stock.
- Chaikin Money Flow (CMF): The CMF has been negative, suggesting that money is flowing out of the stock.
Key Observations and Opinions:
- Trend: The short-term trend is slightly bullish based on the moving averages, but the MACD signals a potential reversal.
- Momentum: The momentum indicators are mixed, with RSI indicating neutrality and Stochastic Oscillator hinting at a possible reversal.
- Volatility: Volatility has been decreasing, indicating a possible period of consolidation or a calm before a potential price movement.
- Volume: The volume indicators show indecision among investors, with money flowing out of the stock based on CMF.
Conclusion:
Based on the analysis of the technical indicators, the stock of ICF is likely to experience sideways movement or consolidation in the next few days. The mixed signals from trend, momentum, volatility, and volume indicators suggest a lack of clear direction in the stock price. Investors should closely monitor the key support and resistance levels for potential breakout opportunities.