Technical Analysis of ICSH 2024-05-10
Overview:
In analyzing the technical indicators for ICSH over the last 5 days, we will delve into the trend, momentum, volatility, and volume indicators to provide a comprehensive outlook on the possible stock price movement. By examining these key indicators, we aim to offer valuable insights and predictions for the upcoming trading days.
Trend Analysis:
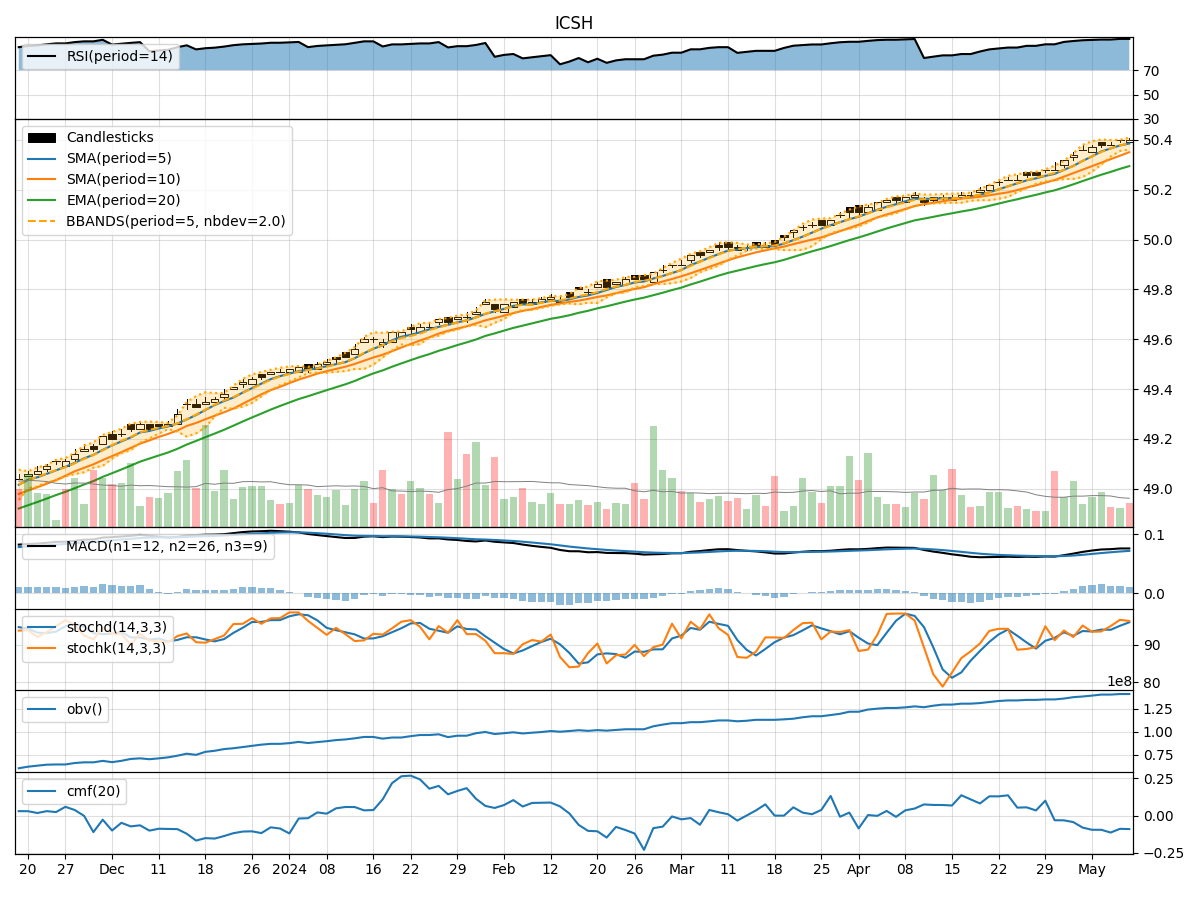
- Moving Averages (MA): The 5-day Moving Average (MA) has been consistently above the Simple Moving Average (SMA) and Exponential Moving Average (EMA), indicating a bullish trend.
- MACD: The MACD line has been consistently positive, with the MACD Histogram also showing an upward trend, suggesting bullish momentum in the stock price.
Momentum Analysis:
- RSI: The Relative Strength Index (RSI) has been consistently high, indicating overbought conditions in the stock.
- Stochastic Oscillator: Both %K and %D lines of the Stochastic Oscillator have been in the overbought zone, signaling a potential reversal or consolidation.
Volatility Analysis:
- Bollinger Bands: The Bollinger Bands have been narrowing, indicating decreasing volatility in the stock price.
- Bollinger %B: The %B indicator has been fluctuating around the midline, suggesting a period of consolidation.
Volume Analysis:
- On-Balance Volume (OBV): The OBV indicator has been relatively flat, indicating a balance between buying and selling pressure.
- Chaikin Money Flow (CMF): The CMF has been negative, suggesting outflow of money from the stock.
Key Observations and Opinions:
- Trend: The stock is currently in an upward trend based on moving averages and MACD analysis.
- Momentum: The stock is showing signs of overbought conditions based on RSI and Stochastic Oscillator readings.
- Volatility: Volatility is decreasing, as indicated by the narrowing Bollinger Bands.
- Volume: The volume indicators suggest a neutral stance with balanced buying and selling pressure.
Conclusion:
Based on the analysis of the technical indicators, the next few days' possible stock price movement for ICSH is likely to experience a consolidation phase. The stock may trade within a range as it digests the recent bullish momentum and overbought conditions. Traders should exercise caution and wait for clearer signals before making significant trading decisions.