Technical Analysis of IDAT 2024-05-10
Overview:
In analyzing the technical indicators for IDAT stock over the last 5 days, we will delve into the trends, momentum, volatility, and volume indicators to provide a comprehensive outlook on the possible stock price movement in the coming days. By examining these key aspects, we aim to offer valuable insights and recommendations for potential investors.
Trend Indicators:
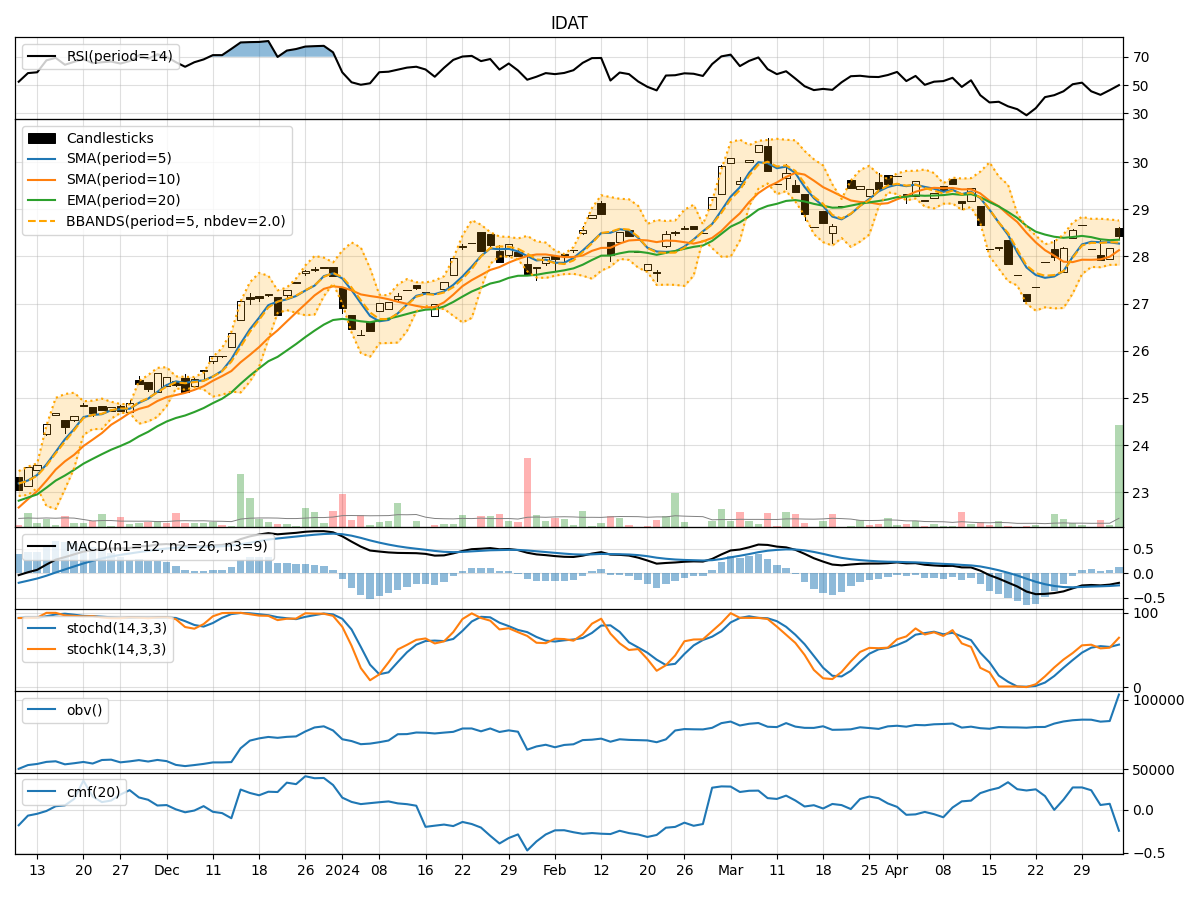
- Moving Averages (MA): The 5-day Moving Average (MA) has been consistently above the Simple Moving Average (SMA) and Exponential Moving Average (EMA), indicating a bullish trend.
- MACD: The MACD line has been consistently above the signal line, suggesting a positive momentum in the stock price.
- MACD Histogram: The MACD Histogram has been increasing, indicating strengthening bullish momentum.
Momentum Indicators:
- RSI: The Relative Strength Index (RSI) has been gradually increasing, approaching the overbought territory but still within a reasonable range.
- Stochastic Oscillator: Both %K and %D lines of the Stochastic Oscillator are in the overbought zone, signaling a potential reversal or consolidation.
- Williams %R: The Williams %R is at 0, indicating a potential overbought condition.
Volatility Indicators:
- Bollinger Bands: The stock price has been trading within the Bollinger Bands, with the bands narrowing, suggesting a period of consolidation.
- Bollinger %B: The %B indicator is around 0.8, indicating that the stock price is closer to the upper band, potentially signaling a short-term overbought condition.
Volume Indicators:
- On-Balance Volume (OBV): The OBV has been relatively stable, indicating a neutral volume flow.
- Chaikin Money Flow (CMF): The CMF has been negative, suggesting a bearish money flow in the stock.
Key Observations and Opinions:
- Trend: The stock is in a strong bullish trend based on moving averages and MACD indicators.
- Momentum: Momentum indicators suggest a potential overbought condition, signaling a need for caution.
- Volatility: Bollinger Bands indicate a period of consolidation, while %B suggests a short-term overbought scenario.
- Volume: Volume indicators show a neutral volume flow with a bearish money flow based on CMF.
Conclusion:
Based on the analysis of the technical indicators, the next few days' possible stock price movement for IDAT is likely to experience a short-term consolidation or pullback. The bullish trend may pause temporarily due to the overbought signals from momentum indicators and the potential overbought condition indicated by the Bollinger %B. Investors should exercise caution and consider waiting for a better entry point before initiating new positions.