Technical Analysis of IDEC 2024-05-10
Overview:
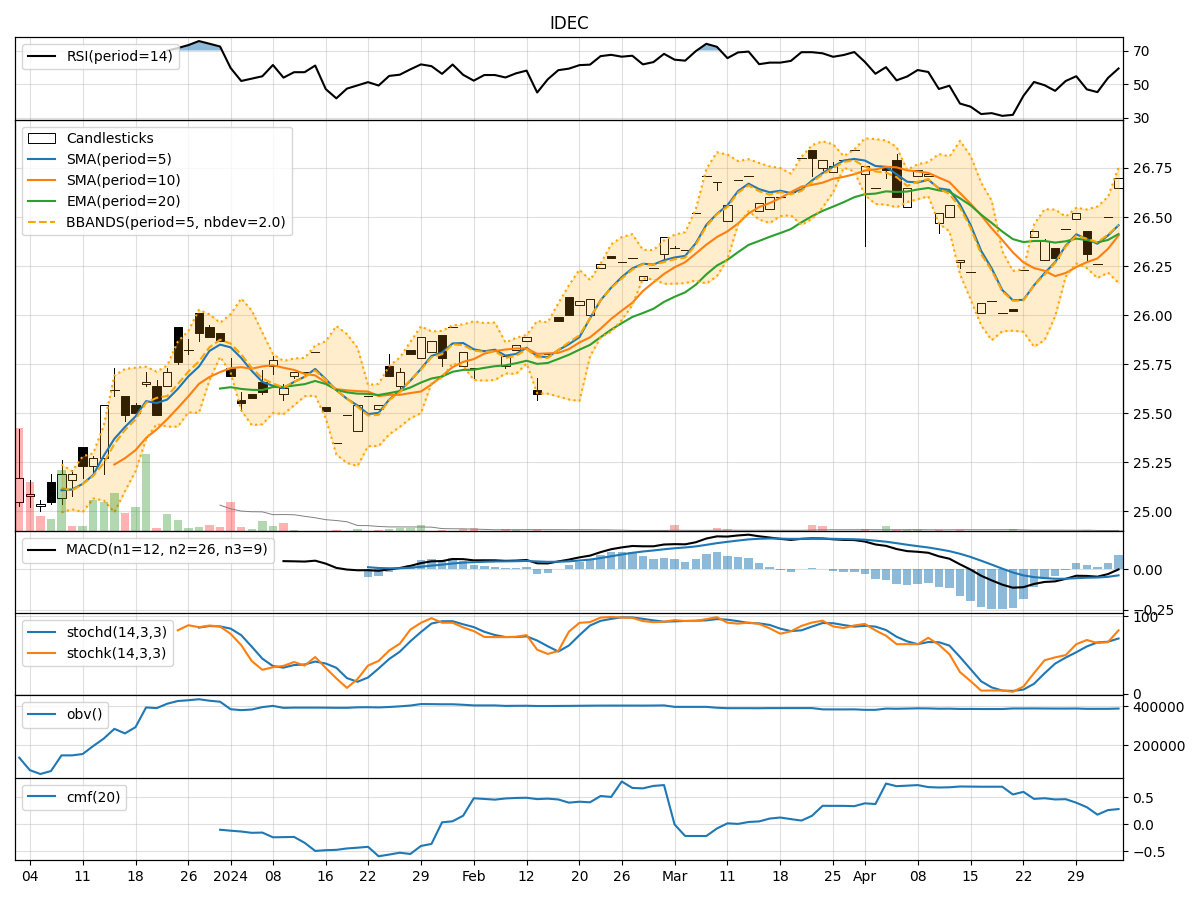
In analyzing the technical indicators for IDEC over the last 5 days, we will delve into the trend, momentum, volatility, and volume indicators to provide a comprehensive outlook on the possible stock price movement. By examining these key indicators, we aim to offer valuable insights and predictions for the upcoming days.
Trend Indicators:
- Moving Averages (MA): The 5-day MA has been consistently above the closing price, indicating a bullish trend.
- MACD: The MACD line has been trending upwards, with the MACD histogram showing positive values, suggesting bullish momentum.
- EMA: The EMA has been steadily increasing, supporting the bullish trend.
Key Observation: The trend indicators point towards a bullish sentiment in the stock price movement.
Momentum Indicators:
- RSI: The RSI has been in the overbought territory, indicating strong buying momentum.
- Stochastic Oscillator: Both %K and %D have been at 100, signaling strong upward momentum.
- Williams %R: The indicator has consistently been at 0, reflecting a strong bullish sentiment.
Key Observation: Momentum indicators suggest a strong bullish momentum in the stock.
Volatility Indicators:
- Bollinger Bands (BB): The stock price has been trading within the upper Bollinger Band, indicating increased volatility.
- Bollinger %B: The %B value has been fluctuating around 0.8, suggesting a relatively high volatility level.
Key Observation: Volatility indicators point towards increased volatility in the stock price.
Volume Indicators:
- On-Balance Volume (OBV): The OBV has been fluctuating, indicating mixed buying and selling pressure.
- Chaikin Money Flow (CMF): The CMF has been positive, suggesting buying pressure in the stock.
Key Observation: Volume indicators show a mixed sentiment in terms of buying and selling pressure.
Conclusion:
Based on the analysis of the technical indicators, the overall outlook for IDEC stock price movement in the next few days is bullish. The trend indicators, momentum indicators, and volatility indicators all point towards a continued upward movement in the stock price. However, the mixed signals from the volume indicators suggest some caution, as there may be fluctuations in buying and selling pressure.
Key Conclusion: The stock is likely to experience upward movement in the next few days, but investors should monitor volume indicators closely for any potential shifts in market sentiment.