Technical Analysis of IDEV 2024-05-10
Overview:
In analyzing the technical indicators for IDEV over the last 5 days, we will delve into the trend, momentum, volatility, and volume indicators to provide a comprehensive outlook on the possible stock price movement in the coming days.
Trend Analysis:
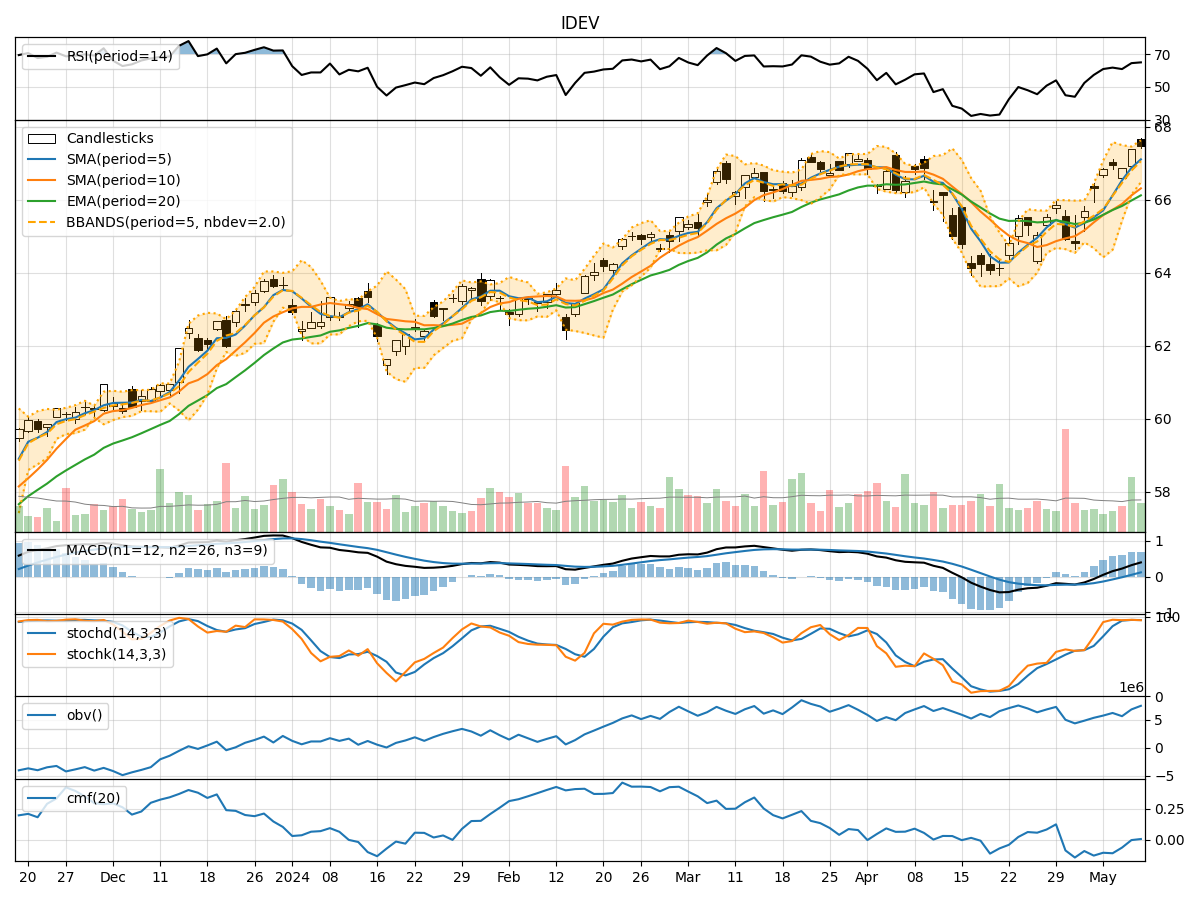
- Moving Averages (MA): The 5-day Moving Average has been consistently rising, indicating a bullish trend in the short term.
- MACD: The MACD line has been above the signal line for the past 5 days, suggesting a bullish momentum.
- RSI: The Relative Strength Index has been increasing, showing strengthening buying pressure.
Momentum Analysis:
- Stochastic Oscillator: Both %K and %D have been in the overbought zone, indicating a strong bullish momentum.
- Williams %R: The Williams %R is in the oversold territory, suggesting a potential reversal in the short term.
Volatility Analysis:
- Bollinger Bands: The stock price has been trading within the upper Bollinger Band, indicating an overbought condition.
- Volatility: The volatility has been relatively stable over the past 5 days.
Volume Analysis:
- On-Balance Volume (OBV): The OBV has been fluctuating, indicating indecision among investors.
- Chaikin Money Flow (CMF): The CMF has been negative, suggesting selling pressure in the market.
Key Observations:
- The trend indicators suggest a bullish sentiment in the short term.
- Momentum indicators show a strong bullish momentum but also hint at a potential reversal.
- Volatility remains stable, indicating a lack of significant price fluctuations.
- Volume indicators reflect mixed signals with fluctuating OBV and negative CMF.
Conclusion:
Based on the analysis of the technical indicators, the stock price of IDEV is likely to experience further upward movement in the coming days. The bullish trend supported by moving averages and MACD, coupled with strong momentum indicated by the Stochastic Oscillator, suggests a positive outlook. However, caution is advised as the Williams %R shows an oversold condition, and the CMF indicates selling pressure. Traders should closely monitor price action for any signs of a potential reversal despite the overall bullish sentiment.