Technical Analysis of IDGT 2024-05-10
Overview:
In analyzing the technical indicators for IDGT over the last 5 days, we will delve into the trend, momentum, volatility, and volume indicators to provide a comprehensive outlook on the possible stock price movement in the coming days. By examining these key aspects, we aim to offer valuable insights and predictions for potential investors.
Trend Indicators:
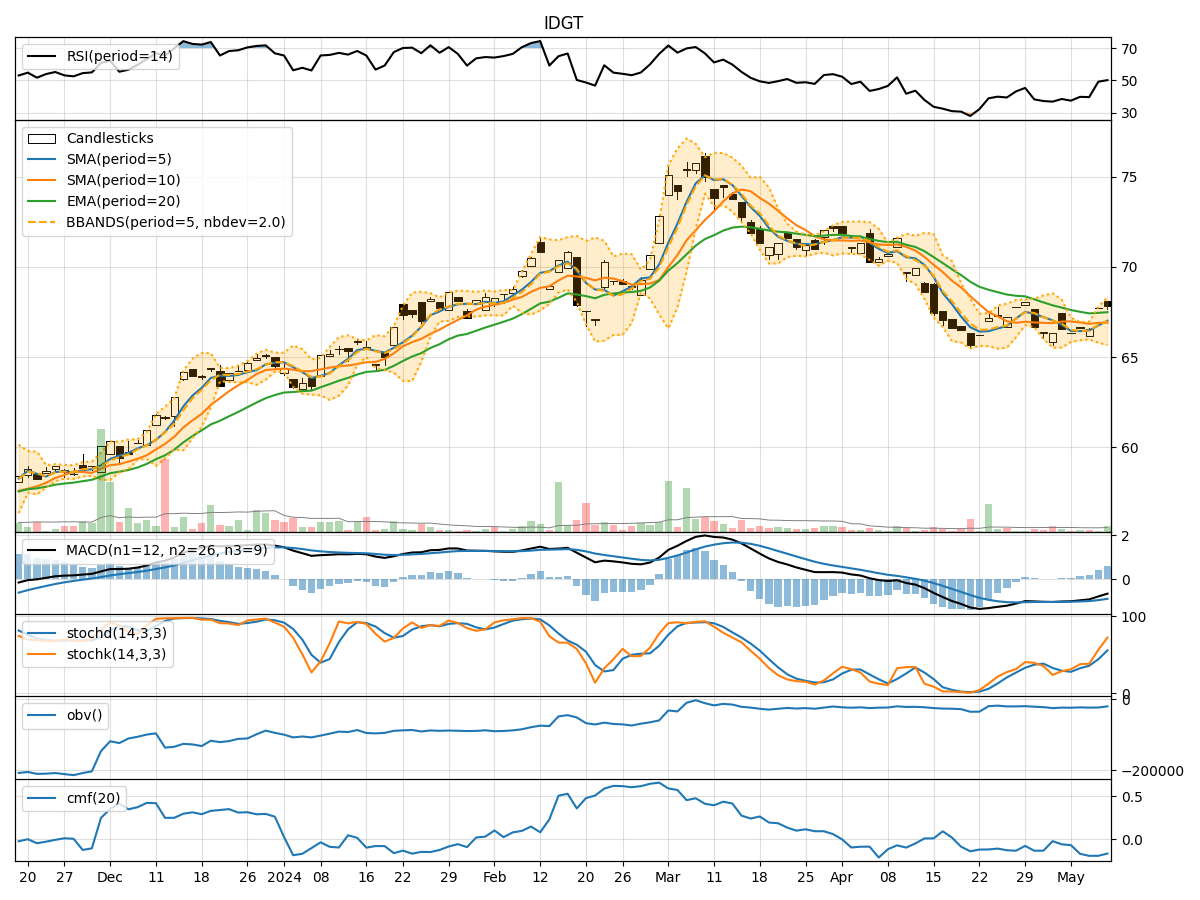
- Moving Averages (MA): The 5-day MA has been fluctuating around the actual closing prices, indicating short-term price trends. The SMA(10) and EMA(20) have been gradually declining, suggesting a bearish sentiment in the medium to long term.
- MACD and Signal Line: The MACD has been negative, with the MACD line consistently below the signal line, indicating a bearish trend in momentum.
- Conclusion: The trend indicators point towards a bearish outlook for IDGT in the near future.
Momentum Indicators:
- RSI (Relative Strength Index): The RSI has been relatively low, indicating a potential oversold condition in the stock.
- Stochastic Oscillator: Both %K and %D have been rising, suggesting increasing buying pressure.
- Williams %R: The Williams %R is in the oversold territory, indicating a potential reversal in price.
- Conclusion: Momentum indicators suggest a potential reversal in the stock's price movement.
Volatility Indicators:
- Bollinger Bands: The stock price has been trading within the Bollinger Bands, with the bands widening, indicating increased volatility.
- Conclusion: Volatility indicators suggest increased volatility in the stock price.
Volume Indicators:
- On-Balance Volume (OBV): The OBV has been relatively stable, indicating a balance between buying and selling pressure.
- Chaikin Money Flow (CMF): The CMF has been negative, suggesting a bearish money flow.
- Conclusion: Volume indicators point towards a neutral to bearish sentiment in the stock.
Overall Conclusion:
Based on the analysis of the trend, momentum, volatility, and volume indicators, the next few days' possible stock price movement for IDGT is likely to be sideways with a bearish bias. While momentum indicators hint at a potential reversal, the overall trend and volume indicators suggest a bearish sentiment. Investors should exercise caution and closely monitor the price action for any signs of a definitive trend reversal before making any investment decisions.