Technical Analysis of IDHQ 2024-05-10
Overview:
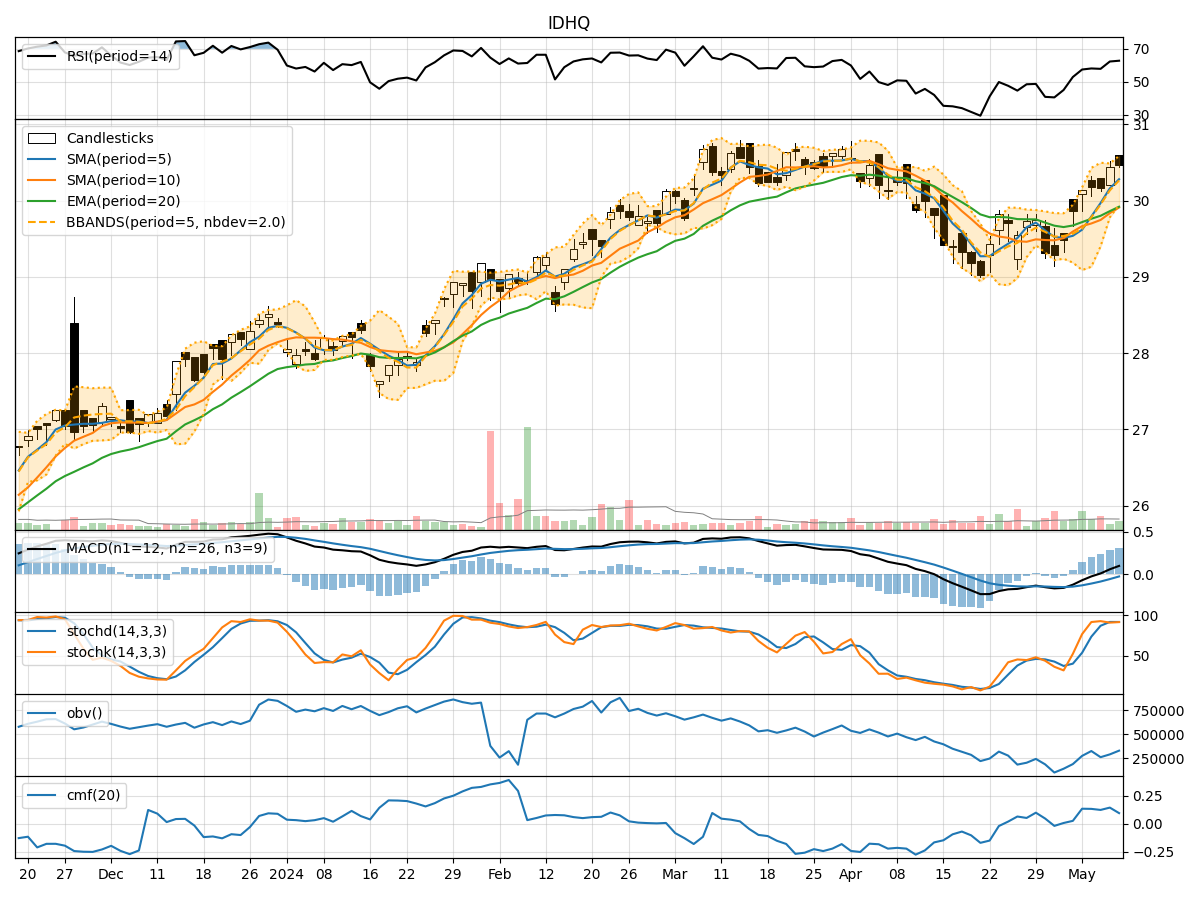
In analyzing the technical indicators for IDHQ stock over the last 5 days, we will delve into the trends, momentum, volatility, and volume indicators to provide a comprehensive outlook on the possible future stock price movement. By examining key metrics such as moving averages, MACD, RSI, Bollinger Bands, and OBV, we aim to offer valuable insights and predictions for the upcoming trading days.
Trend Indicators:
- Moving Averages (MA): The 5-day MA has been consistently above the closing prices, indicating a short-term uptrend.
- MACD: The MACD line has been above the signal line for the past few days, suggesting bullish momentum.
- EMA: The EMA has been trending upwards, reflecting a positive price trend.
Key Observation: The trend indicators point towards a bullish sentiment in the short term.
Momentum Indicators:
- RSI: The RSI has been in the overbought territory, indicating strong buying momentum.
- Stochastic Oscillator: Both %K and %D have been in the overbought zone, signaling potential overvaluation.
- Williams %R: The indicator has been in the oversold region, suggesting a possible reversal.
Key Observation: Momentum indicators suggest a mixed outlook with signs of potential overbought conditions.
Volatility Indicators:
- Bollinger Bands: The stock price has been trading within the bands, indicating normal volatility.
- Bollinger %B: The %B value has been fluctuating around 0.8, suggesting moderate volatility.
Key Observation: Volatility indicators imply a stable price movement with no extreme fluctuations.
Volume Indicators:
- On-Balance Volume (OBV): The OBV has shown a positive trend, indicating accumulation by investors.
- Chaikin Money Flow (CMF): The CMF has been positive, reflecting buying pressure in the stock.
Key Observation: Volume indicators signal positive investor sentiment and buying interest.
Conclusion:
Based on the analysis of trend, momentum, volatility, and volume indicators, the overall outlook for IDHQ stock in the next few days appears to be bullish with a potential for further upside movement. While momentum indicators suggest a slight caution due to overbought conditions, the overall trend, volume, and volatility indicators support a positive price trajectory. Traders may consider entering long positions with proper risk management strategies in place to capitalize on the anticipated upward movement in the stock price.
Key Conclusion:
The technical analysis indicates a bullish outlook for IDHQ stock in the upcoming trading days, supported by positive trends, volume accumulation, and stable volatility. Investors should monitor the momentum indicators for any signs of potential pullback but overall, the stock is poised for an upward trajectory.