Technical Analysis of IDRV 2024-05-10
Overview:
In analyzing the technical indicators for IDRV over the last 5 days, we will delve into the trend, momentum, volatility, and volume indicators to provide a comprehensive outlook on the possible stock price movement in the coming days. By examining these key indicators, we aim to offer valuable insights and predictions for potential investors.
Trend Analysis:
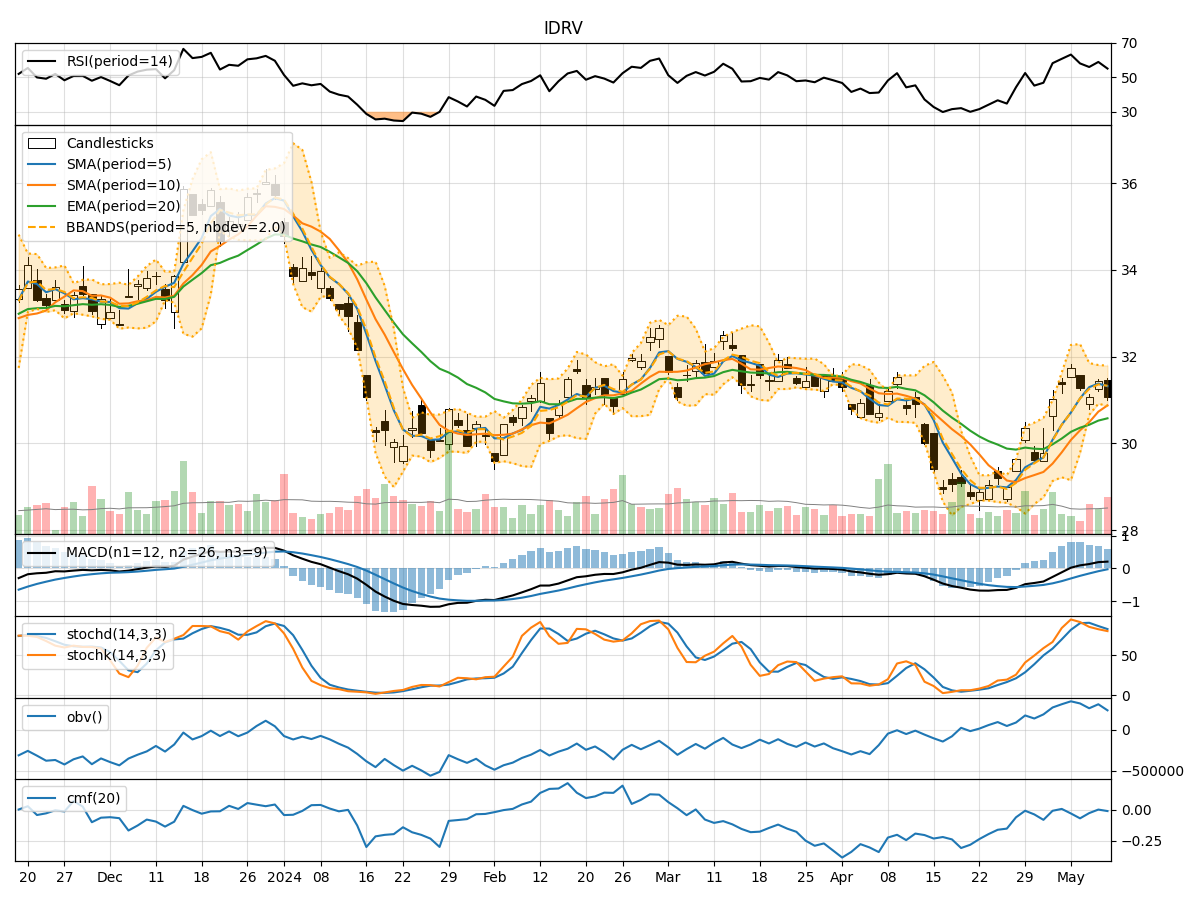
- Moving Averages (MA): The 5-day Moving Average (MA) has been consistently above the Simple Moving Average (SMA) and Exponential Moving Average (EMA), indicating a bullish trend.
- MACD: The MACD line has been above the signal line, with both lines showing an upward trend, suggesting bullish momentum.
Key Observation: The trend indicators point towards an upward trend in the stock price.
Momentum Analysis:
- RSI: The Relative Strength Index (RSI) has been fluctuating around the 50 level, indicating a neutral momentum.
- Stochastic Oscillator: Both %K and %D have been decreasing, suggesting a potential reversal in momentum.
Key Observation: The momentum indicators suggest a neutral to slightly bearish momentum in the stock.
Volatility Analysis:
- Bollinger Bands (BB): The stock price has been trading within the Bollinger Bands, with the bands narrowing, indicating decreasing volatility.
Key Observation: Volatility is decreasing, which may lead to a period of consolidation or a potential breakout.
Volume Analysis:
- On-Balance Volume (OBV): The OBV has been fluctuating, indicating indecision among investors.
- Chaikin Money Flow (CMF): The CMF has been negative, suggesting selling pressure in the stock.
Key Observation: Volume indicators reflect indecisiveness and selling pressure in the stock.
Conclusion:
Based on the analysis of the technical indicators, the stock of IDRV is likely to experience sideways movement in the coming days. While the trend indicators suggest an upward trajectory, the momentum indicators point towards a neutral to slightly bearish sentiment. The decreasing volatility indicates a potential consolidation phase, supported by the volume indicators showing indecision and selling pressure.
Recommendation:
- Short-Term Traders: Consider staying on the sidelines or implementing range-bound strategies due to the expected sideways movement.
- Long-Term Investors: Monitor the stock closely for a potential breakout or trend reversal before making any significant investment decisions.
In conclusion, a cautious approach is advised for IDRV in the near term, considering the mixed signals from the technical indicators. It is essential to remain vigilant and adapt to changing market conditions to capitalize on potential opportunities.