Technical Analysis of IDUB 2024-05-10
Overview:
In analyzing the technical indicators for IDUB over the last 5 days, we will delve into the trend, momentum, volatility, and volume indicators to provide a comprehensive outlook on the possible stock price movement in the coming days. By examining these key aspects, we aim to offer valuable insights and predictions for potential investors and traders.
Trend Indicators:
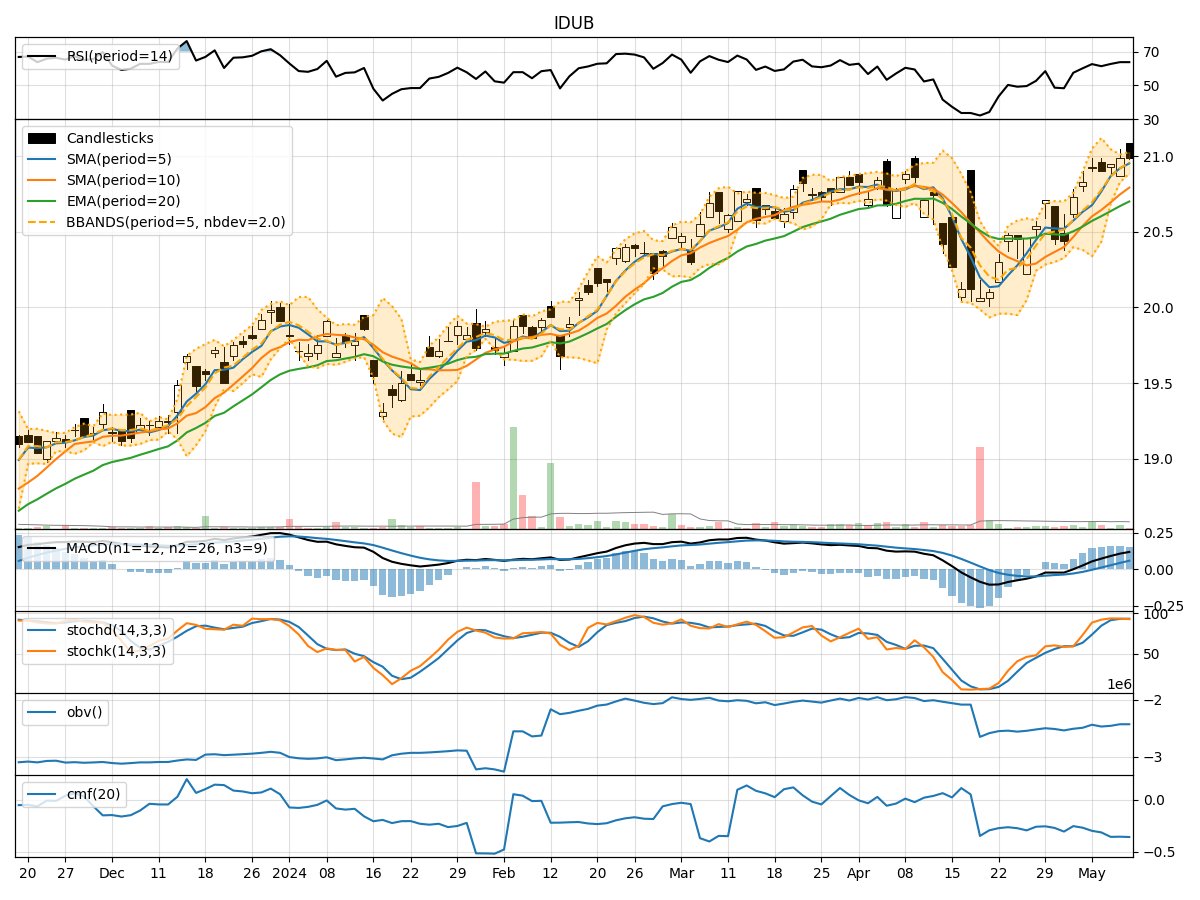
- Moving Averages (MA): The 5-day Moving Average (MA) has been consistently above the Simple Moving Average (SMA) and Exponential Moving Average (EMA), indicating a bullish trend.
- MACD: The MACD line has been consistently above the signal line, with both lines showing an upward trend, suggesting bullish momentum.
- MACD Histogram: The MACD Histogram has been increasing over the past 5 days, indicating strengthening bullish momentum.
Momentum Indicators:
- RSI: The Relative Strength Index (RSI) has been in the overbought territory but has not shown any signs of divergence, indicating strong buying momentum.
- Stochastic Oscillator: Both %K and %D lines of the Stochastic Oscillator have been in the overbought zone, suggesting a strong bullish momentum.
- Williams %R: The Williams %R has been consistently in the oversold territory, indicating a strong bullish sentiment.
Volatility Indicators:
- Bollinger Bands (BB): The stock price has been trading within the Bollinger Bands, with the bands narrowing, suggesting a period of consolidation.
- Bollinger %B: The %B indicator has been hovering around 0.8, indicating that the stock is trading near the upper band, potentially signaling an overbought condition.
Volume Indicators:
- On-Balance Volume (OBV): The OBV has been relatively stable over the past 5 days, indicating a balance between buying and selling pressure.
- Chaikin Money Flow (CMF): The CMF has been negative, suggesting that money flow has been predominantly out of the stock.
Key Observations and Opinions:
- Trend: The trend indicators suggest a strong bullish sentiment in the stock, supported by the moving averages and MACD analysis.
- Momentum: The momentum indicators indicate a robust buying momentum, with overbought conditions in RSI and Stochastic Oscillator.
- Volatility: The narrowing Bollinger Bands and high %B value suggest a potential consolidation phase or a temporary pause in the uptrend.
- Volume: The volume indicators show a balanced OBV but a negative CMF, indicating a lack of strong buying interest.
Conclusion:
Based on the analysis of the technical indicators, the next few days for IDUB are likely to see continued upward movement in the stock price. The strong bullish trend, supported by momentum indicators, suggests that the stock is poised for further gains. However, the narrowing Bollinger Bands and negative CMF signal a potential consolidation phase or a minor pullback before resuming the uptrend. Investors should consider entering long positions with caution and closely monitor the price action for any signs of reversal.