Technical Analysis of IDX 2024-05-10
Overview:
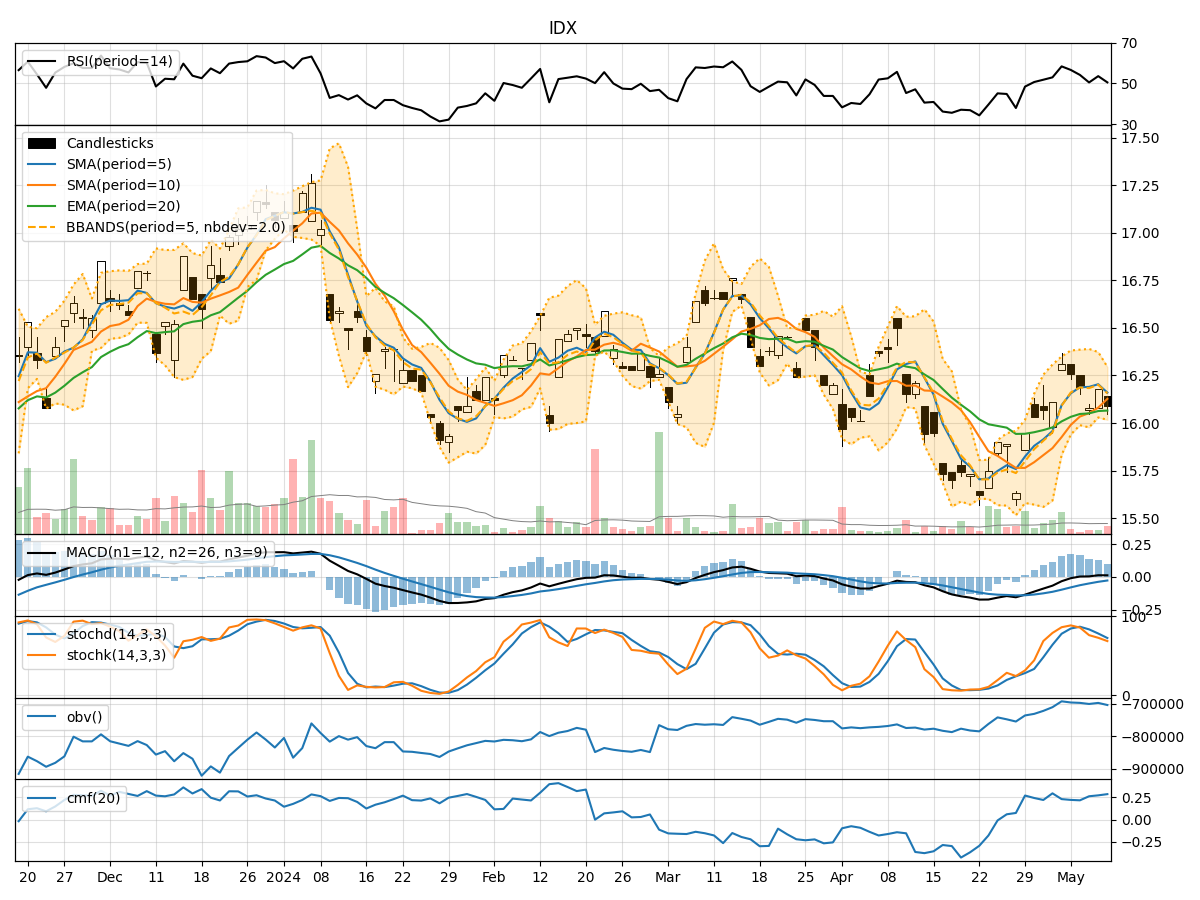
In the last 5 trading days, IDX stock has shown mixed signals across various technical indicators. The trend indicators suggest a slightly bullish sentiment, with the moving averages trending upwards. Momentum indicators show a neutral to slightly bearish outlook, while volatility indicators indicate a narrowing of price movements. Volume indicators suggest a positive accumulation of volume.
Trend Indicators:
- Moving Averages (MA): The 5-day MA is above the 10-day SMA, indicating a short-term bullish trend. The EMA(20) is also trending upwards, supporting a bullish bias.
- MACD: The MACD line is above the signal line, indicating a bullish momentum. However, the MACD histogram is decreasing, suggesting a potential weakening of the bullish momentum.
Momentum Indicators:
- RSI: The RSI is hovering around 50, indicating a neutral momentum. It has not reached overbought or oversold levels, suggesting a lack of strong directional bias.
- Stochastic Oscillator: Both %K and %D are declining, indicating a bearish momentum. The stock is not in oversold territory yet, but the downward trend in the oscillator signals potential weakness.
Volatility Indicators:
- Bollinger Bands (BB): The bands are narrowing, indicating decreasing volatility. This could suggest a period of consolidation or a potential breakout in the near future.
- Bollinger %B: The %B is below 0.5, indicating the stock is trading below the lower Bollinger Band, which could signal an oversold condition.
Volume Indicators:
- On-Balance Volume (OBV): The OBV is showing a positive accumulation of volume, which is a bullish sign. It suggests that buyers are more active than sellers.
- Chaikin Money Flow (CMF): The CMF is positive, indicating that money is flowing into the stock. This supports the bullish sentiment indicated by the OBV.
Conclusion:
Based on the analysis of the technical indicators, the next few days for IDX stock could see sideways consolidation with a slight bullish bias. The moving averages and MACD suggest a continuation of the bullish trend, while the momentum indicators show a neutral to slightly bearish outlook. The narrowing Bollinger Bands and positive volume accumulation indicate a potential period of consolidation before a possible breakout. Traders should watch for a confirmation of a breakout above the upper Bollinger Band for a more definitive bullish signal.