Technical Analysis of IEDI 2024-05-10
Overview:
In analyzing the technical indicators for IEDI stock over the last 5 days, we will delve into the trend, momentum, volatility, and volume indicators to provide a comprehensive outlook on the possible stock price movement in the coming days. By examining these key indicators, we aim to offer valuable insights and predictions to guide your investment decisions.
Trend Indicators:
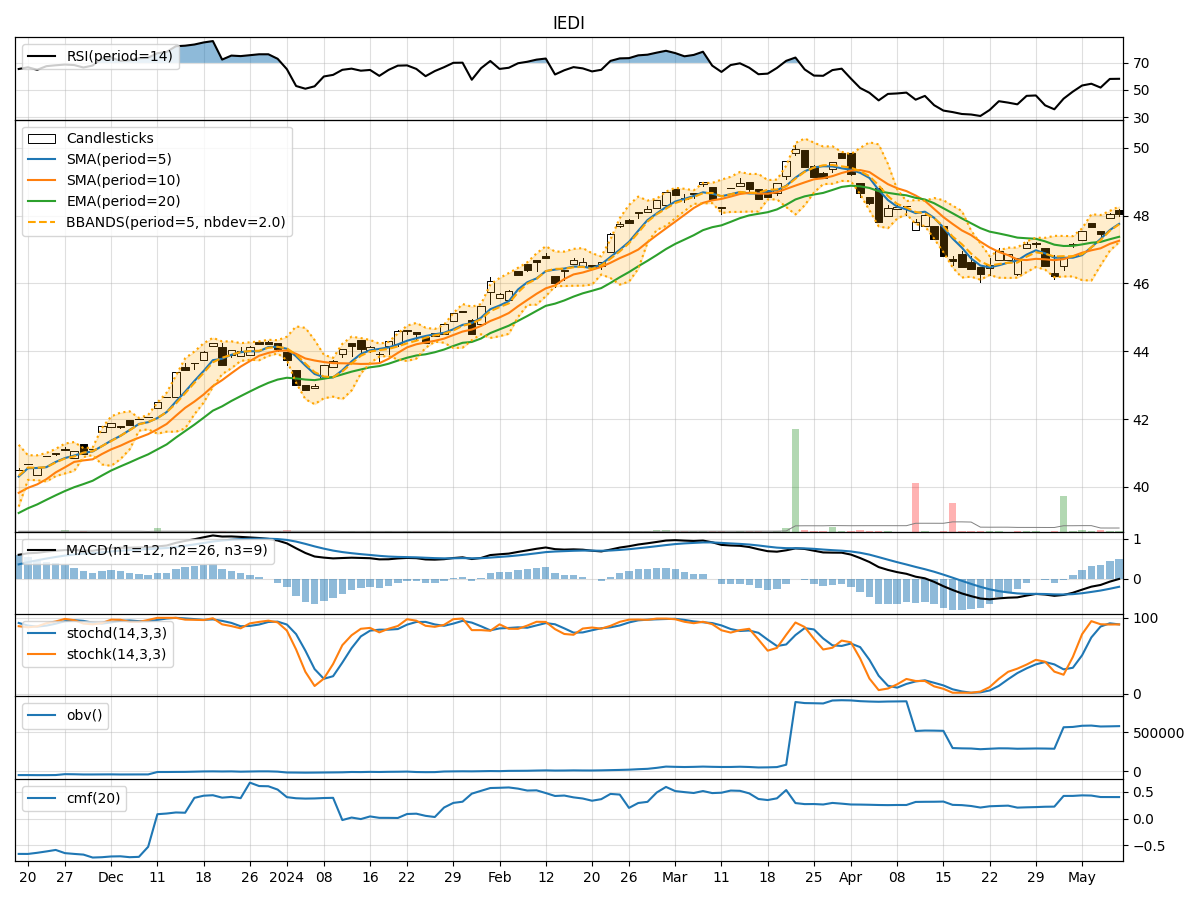
- Moving Averages (MA): The 5-day Moving Average (MA) has been showing an upward trend, indicating a positive momentum in the stock price.
- MACD: The Moving Average Convergence Divergence (MACD) has been consistently positive, suggesting a bullish trend in the stock.
- EMA: The Exponential Moving Average (EMA) has been trending upwards, supporting the bullish sentiment in the stock.
Momentum Indicators:
- RSI: The Relative Strength Index (RSI) has been fluctuating but generally staying within the neutral to slightly overbought territory.
- Stochastic Oscillator: Both %K and %D have been in the overbought zone, indicating a potential reversal or consolidation.
- Williams %R: The Williams %R is showing oversold conditions, suggesting a possible buying opportunity.
Volatility Indicators:
- Bollinger Bands: The Bollinger Bands are narrowing, indicating decreasing volatility and a potential period of consolidation.
- Bollinger %B: The %B indicator is hovering around the middle, suggesting a balanced market sentiment.
- Average True Range (ATR): The ATR is relatively stable, indicating a lack of significant price fluctuations.
Volume Indicators:
- On-Balance Volume (OBV): The OBV has been relatively flat, indicating a balance between buying and selling pressure.
- Chaikin Money Flow (CMF): The CMF is positive but trending downwards, signaling a potential decrease in buying pressure.
Key Observations and Opinions:
- Trend: The overall trend based on moving averages and MACD is bullish.
- Momentum: The momentum indicators suggest a mixed sentiment with potential for a reversal.
- Volatility: Volatility is decreasing, indicating a possible period of consolidation.
- Volume: The volume indicators show a neutral stance with balanced buying and selling pressure.
Conclusion:
Based on the analysis of the technical indicators, the next few days for IEDI stock are likely to see sideways movement with a slight bullish bias. Traders should watch for potential reversals indicated by the momentum indicators and monitor the volatility for any breakout opportunities. It is advisable to maintain a cautious approach and wait for clearer signals before making significant trading decisions.