Technical Analysis of IEFA 2024-05-10
Overview:
In analyzing the technical indicators for IEFA over the last 5 days, we will delve into the trend, momentum, volatility, and volume indicators to provide a comprehensive outlook on the possible stock price movement in the coming days. By examining these key aspects, we aim to offer valuable insights and recommendations for potential investors.
Trend Analysis:
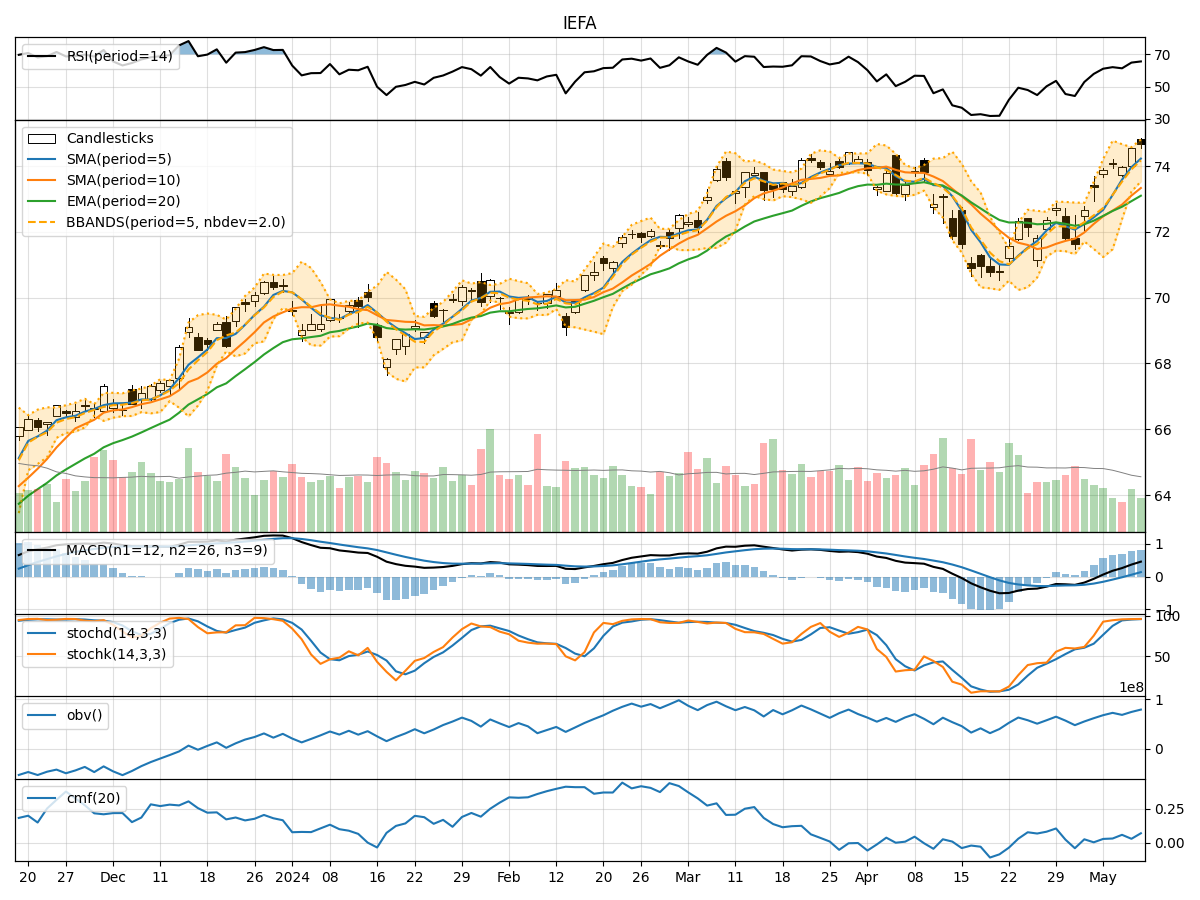
- Moving Averages (MA): The 5-day Moving Average has been consistently rising, indicating a bullish trend in the short term.
- MACD: The MACD line has been above the signal line, suggesting positive momentum in the stock price.
- RSI: The Relative Strength Index has been in the overbought territory, signaling a strong bullish momentum.
Key Observation: The trend indicators point towards a bullish outlook for IEFA.
Momentum Analysis:
- Stochastic Oscillator: Both %K and %D have been in the overbought zone, indicating a strong upward momentum.
- Williams %R: The Williams %R is also in the oversold region, supporting the bullish sentiment.
Key Observation: Momentum indicators align with a bullish sentiment for IEFA.
Volatility Analysis:
- Bollinger Bands: The stock price has been trading close to the upper Bollinger Band, suggesting high volatility.
- Bollinger %B: The %B indicator indicates that the stock is trading near the upper band, signifying a potential overbought condition.
Key Observation: Volatility indicators imply a high volatility environment for IEFA.
Volume Analysis:
- On-Balance Volume (OBV): The OBV has been steadily increasing, indicating strong buying pressure.
- Chaikin Money Flow (CMF): The CMF is positive, reflecting a bullish money flow into the stock.
Key Observation: Volume indicators support a bullish outlook for IEFA.
Conclusion:
Based on the analysis of trend, momentum, volatility, and volume indicators, the overall outlook for IEFA is strongly bullish. The stock is likely to continue its upward trajectory in the coming days, driven by positive trends, momentum, and volume inflow. However, investors should be cautious of the high volatility levels and potential overbought conditions indicated by the Bollinger Bands.
Recommendation: Considering the bullish signals across multiple technical indicators, investors may consider entering long positions in IEFA for potential short to medium-term gains. It is advisable to closely monitor the price action and set appropriate stop-loss levels to manage risks effectively.