Technical Analysis of IEI 2024-05-10
Overview:
In analyzing the technical indicators for IEI over the last 5 days, we will delve into the trend, momentum, volatility, and volume indicators to provide a comprehensive outlook on the possible stock price movement in the coming days. By examining these key indicators, we aim to offer valuable insights and predictions for potential investors.
Trend Analysis:
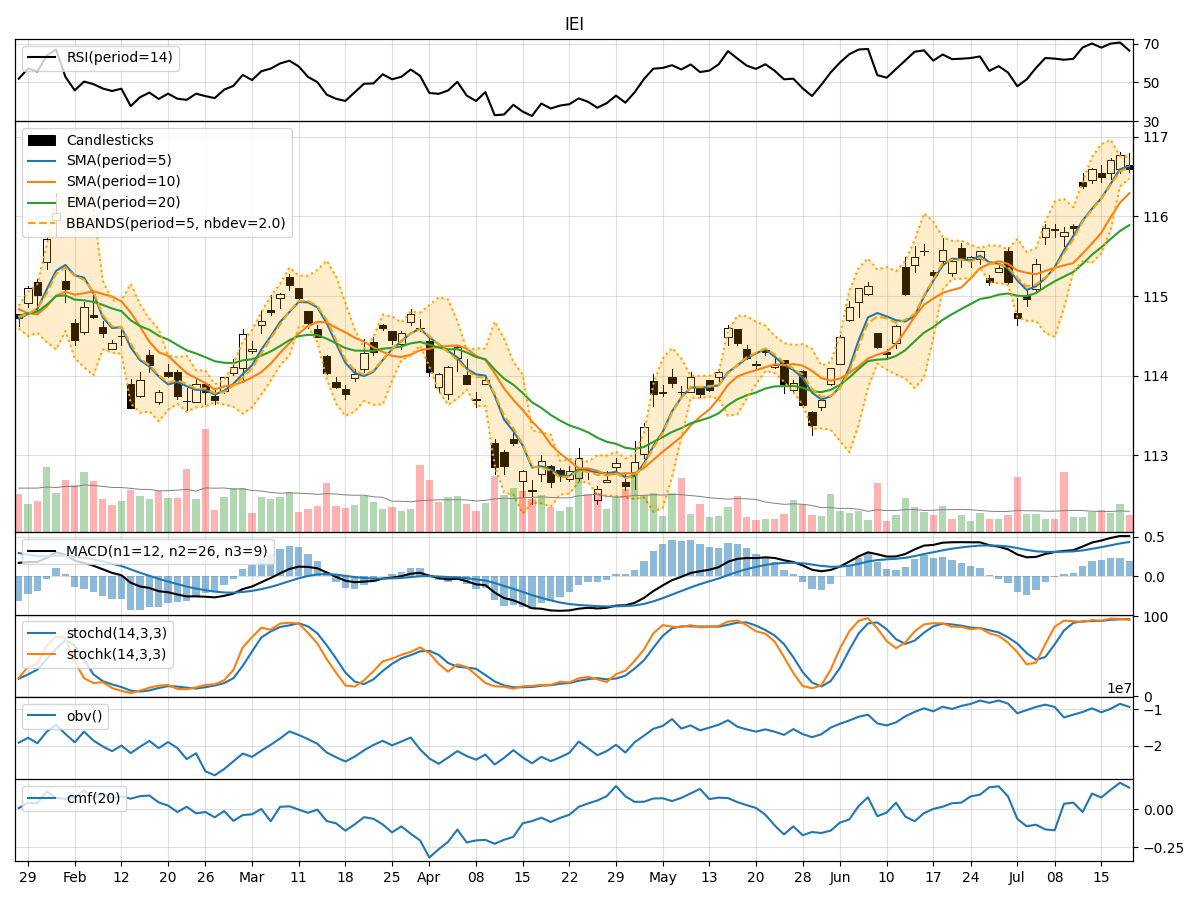
- Moving Averages (MA): The 5-day Moving Average (MA) has been consistently above the Simple Moving Average (SMA) and Exponential Moving Average (EMA), indicating a bullish trend.
- MACD: The MACD line has been consistently above the signal line, suggesting a bullish momentum in the stock price.
- RSI: The Relative Strength Index (RSI) has been fluctuating around the 50 level, indicating a neutral stance in terms of momentum.
Momentum Analysis:
- Stochastic Oscillator: The Stochastic Oscillator has been hovering around the overbought territory, suggesting a potential reversal or consolidation phase.
- Williams %R: The Williams %R indicator has been consistently in the oversold territory, indicating a bearish sentiment in the short term.
Volatility Analysis:
- Bollinger Bands: The Bollinger Bands have been narrowing, indicating decreasing volatility in the stock price.
- Average True Range (ATR): The ATR has been relatively stable, suggesting a lack of significant price movements.
Volume Analysis:
- On-Balance Volume (OBV): The OBV has shown mixed signals, with fluctuations in volume accumulation.
- Chaikin Money Flow (CMF): The CMF has been positive, indicating buying pressure in the stock.
Key Observations:
- The trend indicators suggest a bullish sentiment in the short term.
- Momentum indicators show conflicting signals, with stochastic oscillators hinting at a potential reversal.
- Volatility remains low, indicating a possible period of consolidation.
- Volume indicators show mixed signals, with OBV fluctuating and CMF indicating buying pressure.
Conclusion:
Based on the analysis of the technical indicators, the stock price of IEI is likely to experience sideways movement in the coming days. The bullish trend indicated by moving averages and MACD may be offset by the overbought signals from the stochastic oscillator and bearish sentiment from Williams %R. The low volatility and mixed volume signals further support the expectation of a consolidation phase. Investors should exercise caution and closely monitor the price action for potential entry or exit points.
Recommendation:
Given the current market dynamics and technical indicators, it is advisable to wait for clearer signals before making significant trading decisions. Traders may consider setting tight stop-loss orders to manage risk during this period of uncertainty. Additionally, keeping a close eye on key support and resistance levels can provide valuable insights for potential trading opportunities.
By carefully analyzing the interplay of trend, momentum, volatility, and volume indicators, investors can make more informed decisions and navigate the market with greater confidence.