Technical Analysis of IEUR 2024-05-10
Overview:
In analyzing the technical indicators for IEUR over the last 5 days, we will delve into the trend, momentum, volatility, and volume indicators to provide a comprehensive outlook on the possible stock price movement. By examining these key aspects, we aim to offer valuable insights and predictions for the upcoming days.
Trend Analysis:
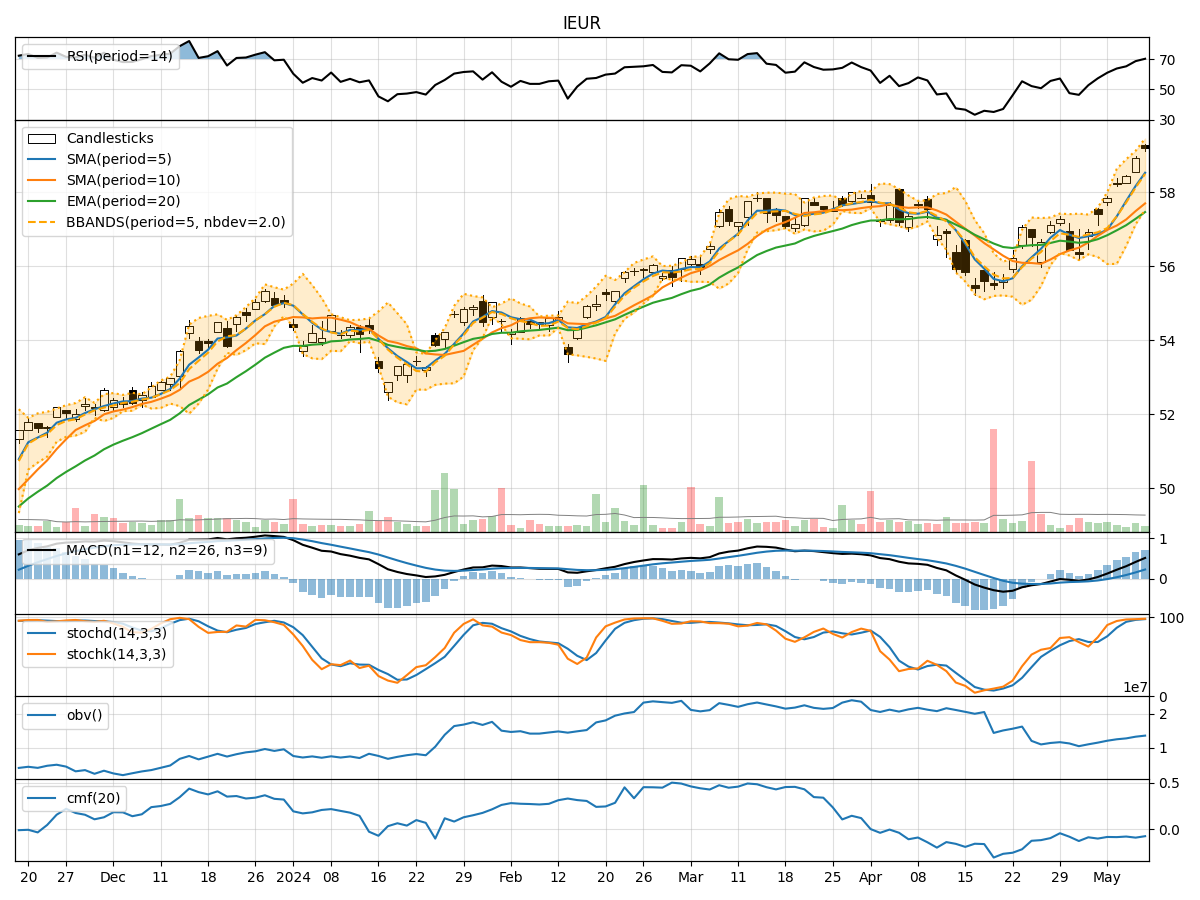
- Moving Averages (MA): The moving averages have been showing a consistent uptrend, with the 5-day MA consistently above the longer-term SMAs and EMAs. This indicates a positive trend in the stock price.
- MACD: The MACD line has been consistently above the signal line, with both lines showing an upward trajectory. This suggests strong bullish momentum in the stock.
- RSI: The RSI has been trending upwards and is currently in the overbought territory, indicating a strong bullish sentiment in the market.
Momentum Analysis:
- Stochastic Oscillator: Both %K and %D lines of the Stochastic Oscillator are in the overbought zone, suggesting that the stock may be overvalued in the short term.
- Williams %R: The Williams %R indicator is also in the oversold region, indicating a potential reversal in the stock price.
Volatility Analysis:
- Bollinger Bands: The Bollinger Bands have been widening, indicating increased volatility in the stock price. The stock has been trading near the upper band, suggesting a potential overbought condition.
- Volatility Bands: The volatility bands have been expanding, indicating a higher degree of price fluctuation in the stock.
Volume Analysis:
- On-Balance Volume (OBV): The OBV has been declining over the last few days, indicating that selling pressure may be increasing.
- Chaikin Money Flow (CMF): The CMF has been negative, suggesting that money may be flowing out of the stock.
Conclusion:
Based on the analysis of the technical indicators, the stock price of IEUR is currently in an overbought condition, with strong bullish momentum but signs of potential reversal in the short term due to overvaluation. The increasing volatility and declining volume indicators also point towards a possible correction or consolidation in the stock price in the upcoming days. Therefore, it is advisable to exercise caution and consider potential profit-taking strategies or wait for a better entry point before considering long positions.