Technical Analysis of IEUS 2024-05-10
Overview:
In analyzing the technical indicators for IEUS over the last 5 days, we will delve into the trend, momentum, volatility, and volume indicators to provide a comprehensive outlook on the possible stock price movement in the coming days. By examining these key indicators, we aim to offer valuable insights and recommendations for potential investors.
Trend Analysis:
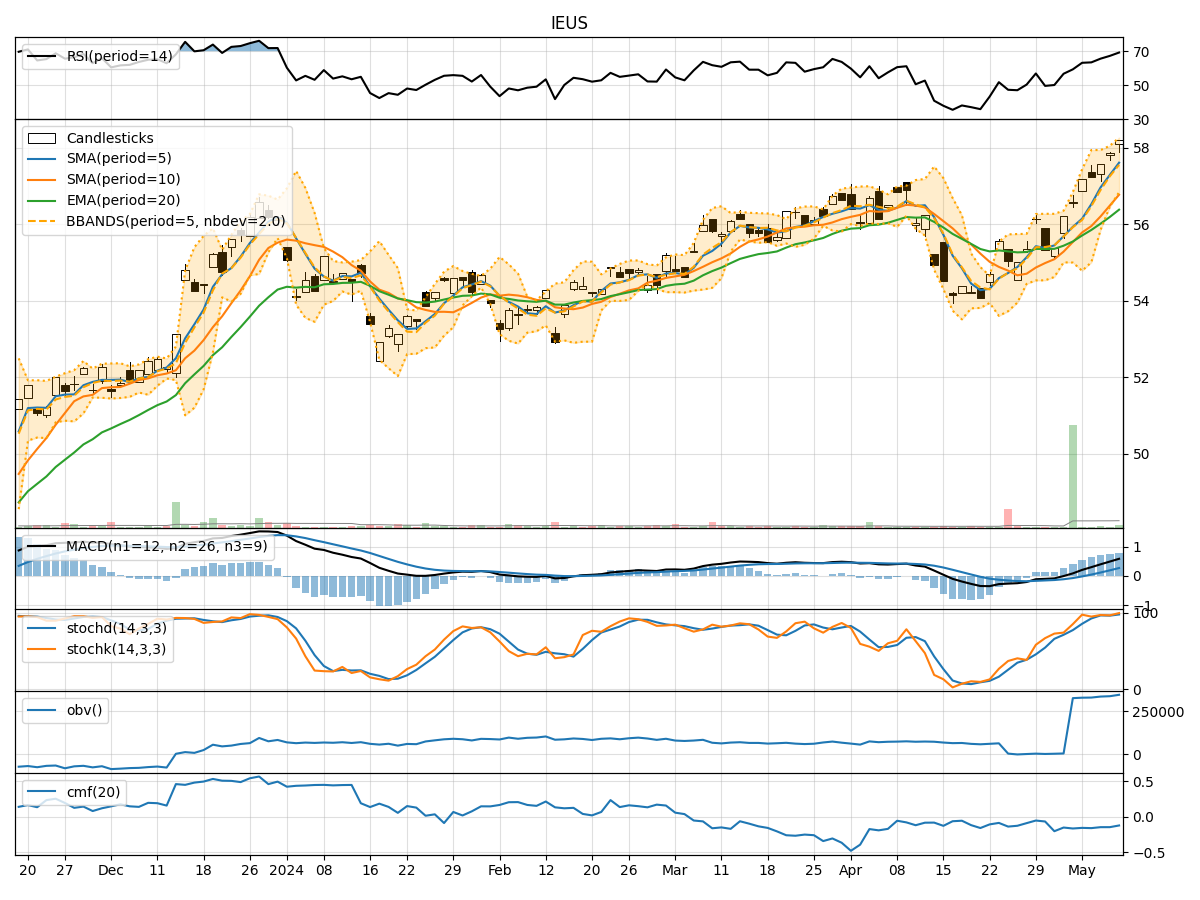
- Moving Averages (MA): The 5-day Moving Average (MA) has been consistently trending upwards, indicating a positive momentum in the stock price.
- MACD: The Moving Average Convergence Divergence (MACD) has shown an increasing trend, with the MACD line consistently above the signal line, suggesting a bullish momentum.
Momentum Analysis:
- RSI: The Relative Strength Index (RSI) has been increasing steadily, reaching overbought levels, indicating a strong bullish momentum.
- Stochastic Oscillator: Both %K and %D lines of the Stochastic Oscillator are in the overbought zone, suggesting a potential reversal or consolidation in the near future.
Volatility Analysis:
- Bollinger Bands: The Bollinger Bands are widening, indicating increased volatility in the stock price.
Volume Analysis:
- On-Balance Volume (OBV): The OBV has been showing a slight increase, suggesting accumulation by investors.
- Chaikin Money Flow (CMF): The CMF has been negative, indicating selling pressure in the stock.
Key Observations and Opinions:
- Trend: The stock is in a strong uptrend based on moving averages and MACD, indicating a bullish view.
- Momentum: The RSI in the overbought zone suggests a potential pullback, while the Stochastic Oscillator signals caution due to being in the overbought region.
- Volatility: Increasing Bollinger Bands point towards heightened volatility, which could lead to larger price swings.
- Volume: The slight increase in OBV indicates some buying interest, but the negative CMF signals selling pressure.
Conclusion:
Based on the analysis of the technical indicators, the next few days' possible stock price movement for IEUS is likely to be upward with a potential for a short-term pullback due to overbought conditions indicated by the RSI and Stochastic Oscillator. Investors should closely monitor the price action for any signs of reversal or consolidation. Overall, the bullish trend supported by moving averages and MACD suggests a positive outlook for the stock in the near term.