Technical Analysis of IEV 2024-05-10
Overview:
In analyzing the technical indicators for IEV over the last 5 days, we will delve into the trend, momentum, volatility, and volume indicators to provide a comprehensive outlook on the possible stock price movement. By examining these key factors, we aim to offer valuable insights and predictions for the upcoming trading days.
Trend Analysis:
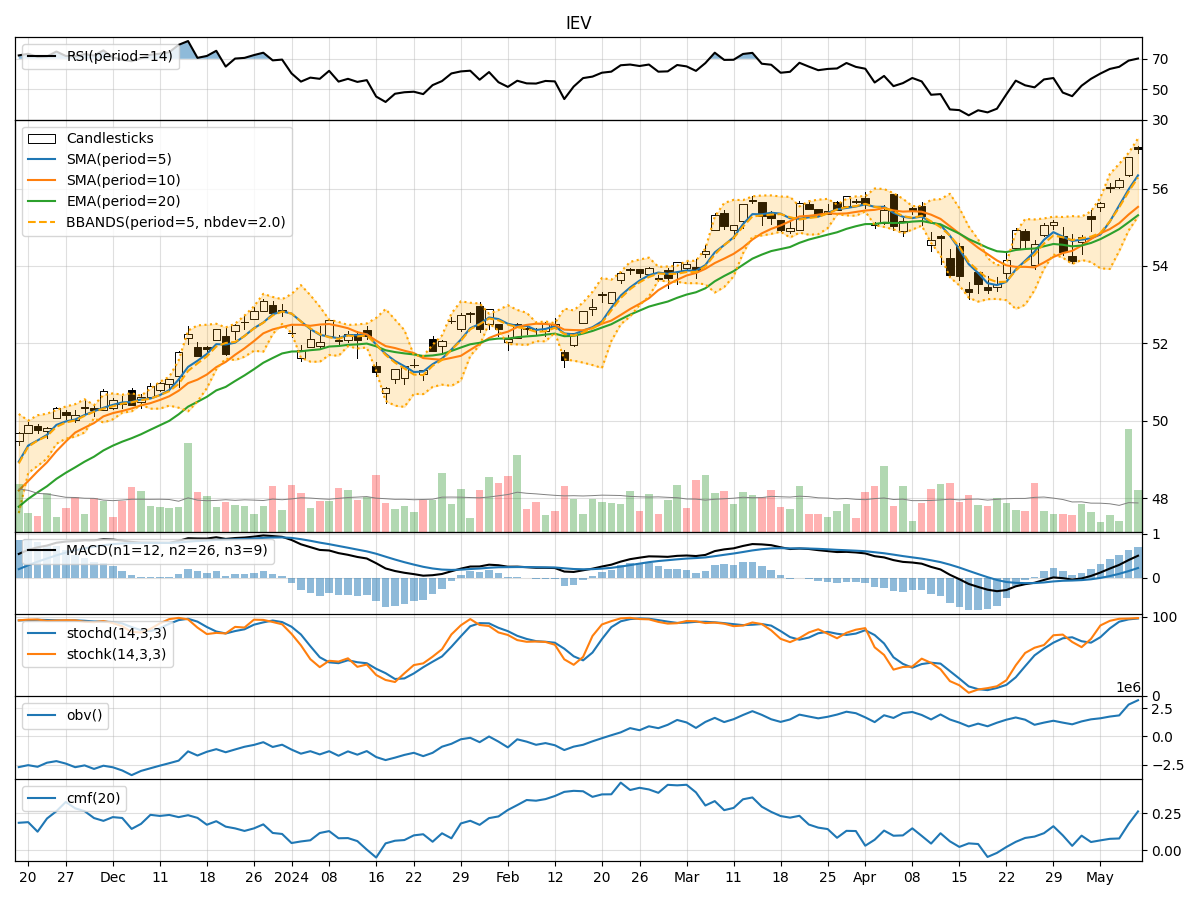
- Moving Averages (MA): The 5-day Moving Average (MA) has been consistently trending above the Simple Moving Average (SMA) and Exponential Moving Average (EMA), indicating a bullish trend.
- MACD: The Moving Average Convergence Divergence (MACD) has shown positive values, with the MACD line consistently above the Signal line, suggesting bullish momentum.
- RSI: The Relative Strength Index (RSI) has been in the overbought territory, indicating strong buying pressure.
Momentum Analysis:
- Stochastic Oscillator: Both %K and %D values have been in the overbought zone, signaling a strong upward momentum.
- Williams %R: The Williams %R indicator has been consistently in the oversold region, suggesting a potential reversal in the short term.
Volatility Analysis:
- Bollinger Bands: The Bollinger Bands have been expanding, indicating increased price volatility.
- BB% (Bollinger Band %B): The %B value has been fluctuating around 0.8, suggesting a relatively high price level within the bands.
Volume Analysis:
- On-Balance Volume (OBV): The OBV indicator has shown a consistent uptrend, reflecting strong buying volume.
- Chaikin Money Flow (CMF): The CMF has been positive, indicating that money is flowing into the stock.
Key Observations:
- The trend indicators suggest a strong bullish sentiment in the short term.
- Momentum indicators point towards a continuation of the upward momentum.
- Volatility indicators indicate increasing price fluctuations.
- Volume indicators show a healthy accumulation of the stock.
Conclusion:
Based on the analysis of the technical indicators, the outlook for IEV in the next few days is bullish. The stock is likely to experience further upward movement, supported by the strong trend, momentum, and volume signals. Traders and investors may consider buying opportunities in anticipation of potential price appreciation. However, it is essential to monitor the indicators closely for any signs of overextension or reversal in the trend.