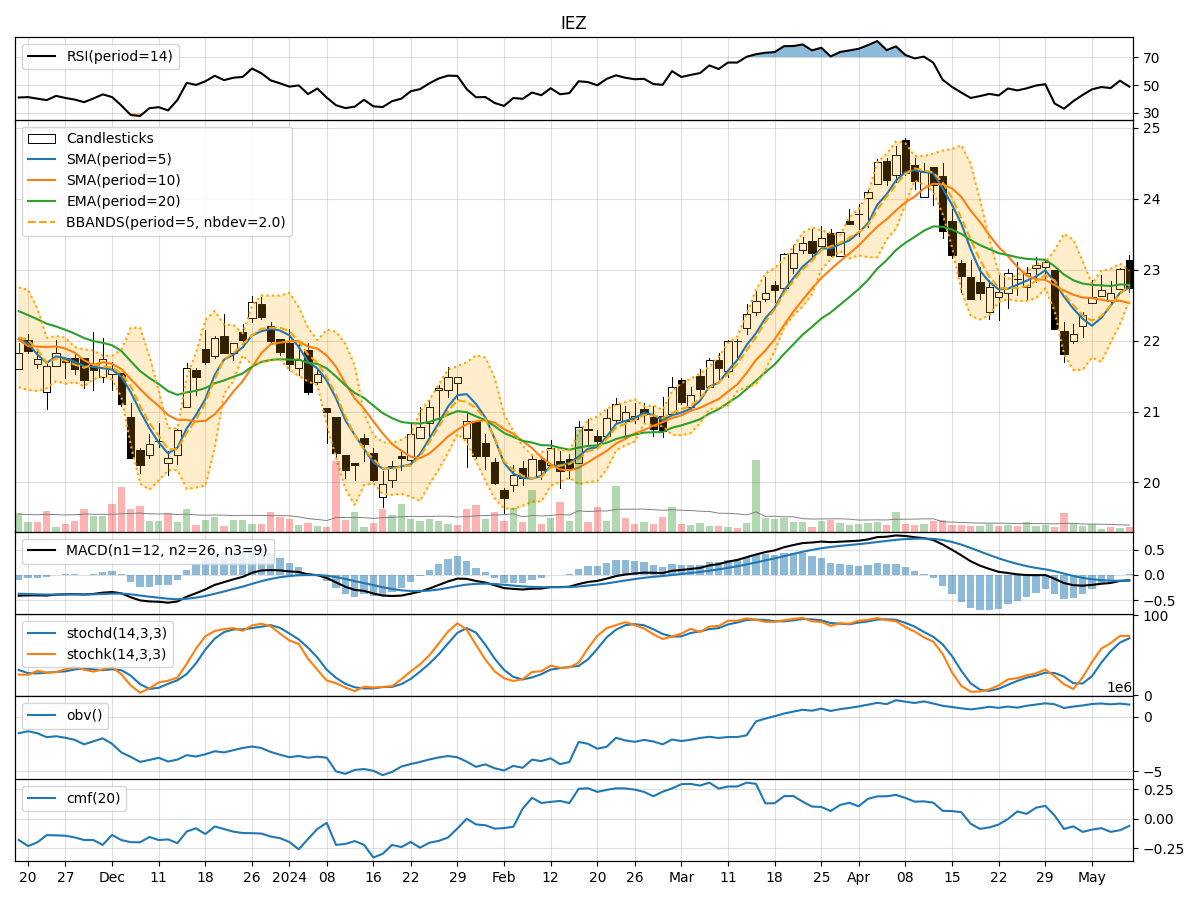
Technical Analysis of IEZ 2024-05-10
Overview:
In analyzing the technical indicators for IEZ over the last 5 days, we will delve into the trend, momentum, volatility, and volume indicators to provide a comprehensive outlook on the possible stock price movement in the coming days.
Trend Analysis:
- Moving Averages (MA): The 5-day Moving Average (MA) has been fluctuating around the closing prices, indicating short-term price trends. The Simple Moving Average (SMA) and Exponential Moving Average (EMA) show a slight downward trend, with the EMA slightly below the SMA.
- MACD: The Moving Average Convergence Divergence (MACD) has been negative, indicating a bearish trend. The MACD Histogram (MACDH) has been decreasing, suggesting weakening bearish momentum.
Momentum Analysis:
- RSI: The Relative Strength Index (RSI) has been hovering around the mid-range, indicating a neutral momentum.
- Stochastic Oscillator: Both %K and %D of the Stochastic Oscillator have been in the overbought zone, suggesting a potential reversal.
- Williams %R: The Williams %R is in the oversold territory, indicating a possible buying opportunity.
Volatility Analysis:
- Bollinger Bands (BB): The Bollinger Bands have been narrowing, indicating decreasing volatility. The price has been trading within the bands, suggesting a period of consolidation.
- Bollinger %B: The %B indicator shows the price nearing the lower band, indicating a potential oversold condition.
Volume Analysis:
- On-Balance Volume (OBV): The OBV has been relatively stable, indicating a balance between buying and selling pressure.
- Chaikin Money Flow (CMF): The CMF has been negative, suggesting outflow of money from the stock.
Key Observations:
- The trend indicators show a slight bearish bias with the MACD in negative territory.
- Momentum indicators suggest a neutral to slightly bearish sentiment.
- Volatility has been decreasing, indicating a period of consolidation.
- Volume indicators show a balance between buying and selling pressure.
Conclusion:
Based on the analysis of the technical indicators, the stock price of IEZ is likely to experience further downward movement in the coming days. The bearish trend indicated by the MACD, coupled with the overbought conditions in the Stochastic Oscillator, suggests a potential reversal to the downside. The narrowing Bollinger Bands and negative CMF further support the bearish outlook. Traders should exercise caution and consider shorting opportunities in the near term.
Disclaimer:
This analysis is based solely on technical indicators and historical data. It is essential to consider other fundamental factors and market dynamics before making any investment decisions. Consulting with a financial advisor is recommended to tailor strategies to individual risk tolerance and investment goals.