Technical Analysis of IFEB 2024-05-10
Overview:
In analyzing the technical indicators for IFEB stock over the last 5 days, we will delve into the trend, momentum, volatility, and volume indicators to provide a comprehensive outlook on the possible stock price movement in the coming days. By examining these key indicators, we aim to offer valuable insights and predictions for potential investors.
Trend Indicators:
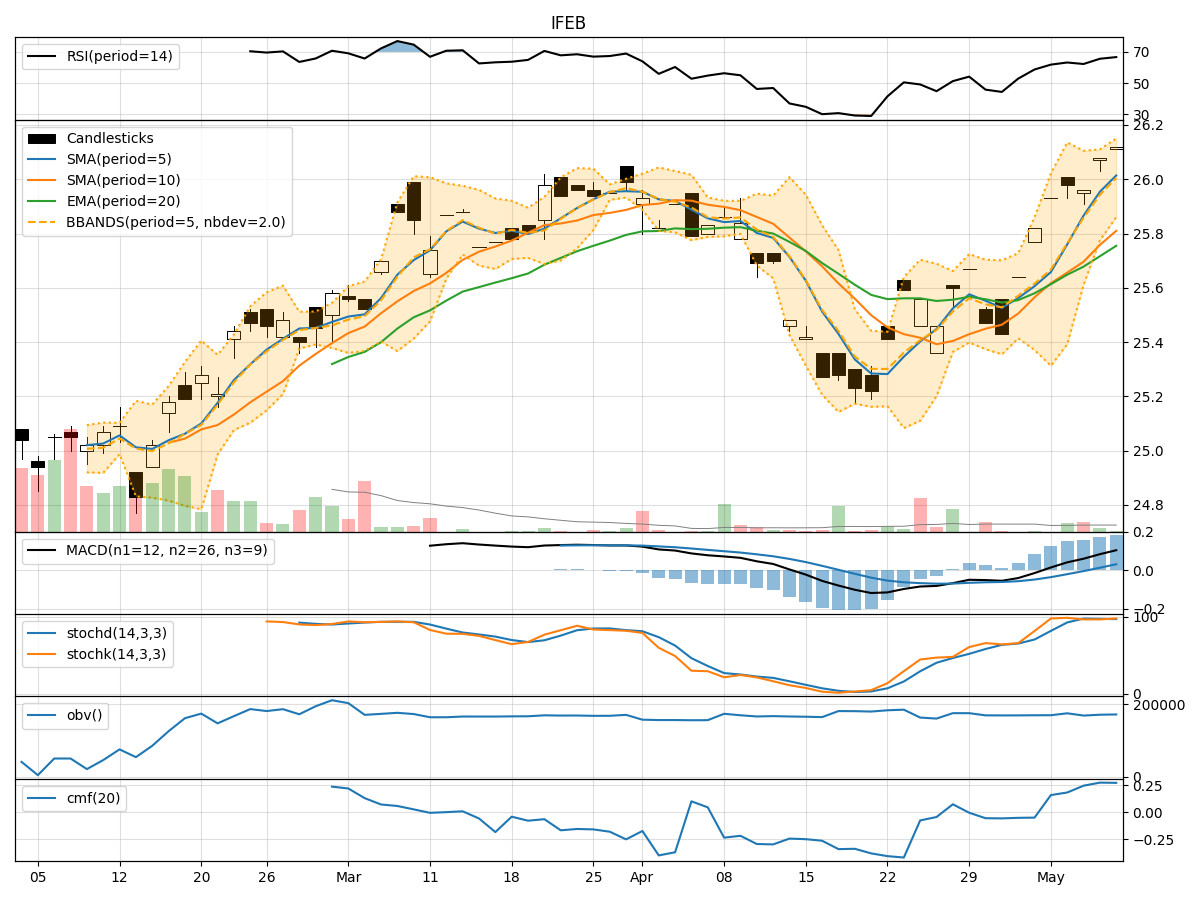
- Moving Averages (MA): The 5-day moving average has been consistently above the simple moving average (SMA) and exponential moving average (EMA), indicating a bullish trend.
- MACD: The MACD line has been consistently above the signal line, with both lines showing an upward trajectory, suggesting a bullish momentum.
Momentum Indicators:
- RSI: The Relative Strength Index (RSI) has been trending upwards, indicating increasing buying pressure.
- Stochastic Oscillator: Both %K and %D have been in the overbought zone, suggesting a strong bullish momentum.
Volatility Indicators:
- Bollinger Bands (BB): The stock price has been consistently trading above the middle Bollinger Band, indicating an upward trend with moderate volatility.
Volume Indicators:
- On-Balance Volume (OBV): The OBV has been showing a positive trend, indicating accumulation by investors.
- Chaikin Money Flow (CMF): The CMF has been consistently positive, reflecting buying pressure in the stock.
Key Observations and Opinions:
- Trend: The trend indicators suggest a strong bullish sentiment in the stock, supported by the moving averages and MACD.
- Momentum: The momentum indicators, particularly the RSI and Stochastic Oscillator, indicate a robust buying momentum.
- Volatility: The Bollinger Bands show moderate volatility, which is typical in a trending market.
- Volume: Both OBV and CMF indicate positive volume flow and buying interest in the stock.
Conclusion:
Based on the analysis of the technical indicators, the IFEB stock is likely to continue its upward trajectory in the coming days. The strong bullish trend, supported by positive momentum and volume indicators, suggests that the stock price may experience further upside potential. Investors could consider buying or holding positions in IFEB stock to capitalize on the ongoing bullish momentum. It is essential to monitor the indicators closely for any signs of reversal or consolidation in the future.