Technical Analysis of IFED 2024-05-10
Overview:
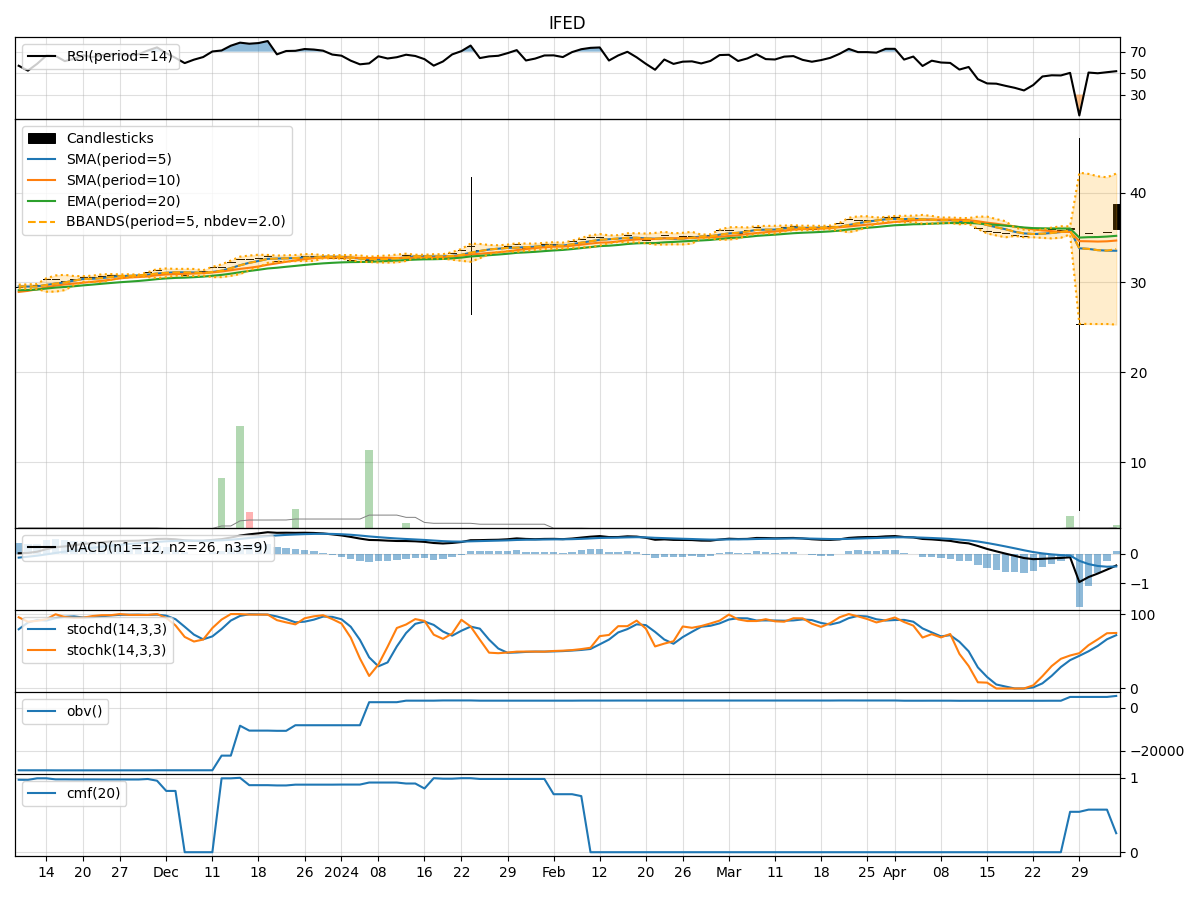
In analyzing the IFED stock using technical indicators over the last 5 days, we will delve into the trend, momentum, volatility, and volume indicators to provide a comprehensive outlook on the possible stock price movement in the coming days.
Trend Indicators:
- Moving Averages (MA): The 5-day MA has been consistently above the 10-day SMA and 20-day EMA, indicating a bullish trend.
- MACD: The MACD line has been consistently above the signal line, suggesting a bullish momentum.
- MACD Histogram: The histogram has been increasing, indicating strengthening bullish momentum.
Momentum Indicators:
- RSI: The RSI has been gradually increasing, indicating strengthening buying pressure.
- Stochastic Oscillator: Both %K and %D have been in the overbought zone, suggesting a potential reversal or consolidation.
- Williams %R: The indicator has been in the oversold territory, signaling a potential buying opportunity.
Volatility Indicators:
- Bollinger Bands (BB): The stock price has been trading within the bands, indicating normal volatility.
- Bollinger %B: The %B indicator has been hovering around 0.8, suggesting the stock is trading near the upper band.
- Average True Range (ATR): The ATR has been relatively stable, indicating consistent volatility levels.
Volume Indicators:
- On-Balance Volume (OBV): The OBV has been increasing, indicating accumulation by investors.
- Chaikin Money Flow (CMF): The CMF has been positive, suggesting buying pressure in the stock.
Key Observations and Opinions:
- Trend: The stock is in a strong bullish trend based on moving averages and MACD.
- Momentum: The RSI and Stochastic Oscillator indicate a potential overbought condition, signaling a possible reversal or consolidation.
- Volatility: The stock has exhibited normal volatility levels within the Bollinger Bands.
- Volume: Accumulation is evident based on the increasing OBV and positive CMF.
Conclusion:
Based on the analysis of the technical indicators, the next few days' possible stock price movement for IFED is likely to be sideways to slightly bearish. The stock may experience a period of consolidation or a minor pullback due to the overbought signals from the momentum indicators. Investors should closely monitor the price action and key support levels for potential buying opportunities in line with the overall bullish trend.