Technical Analysis of IG 2024-05-10
Overview:
In analyzing the technical indicators for the last 5 days of IG stock, we will delve into the trend, momentum, volatility, and volume indicators to provide a comprehensive outlook on the possible stock price movement in the coming days. By examining these key indicators, we aim to offer valuable insights and predictions for informed decision-making.
Trend Indicators:
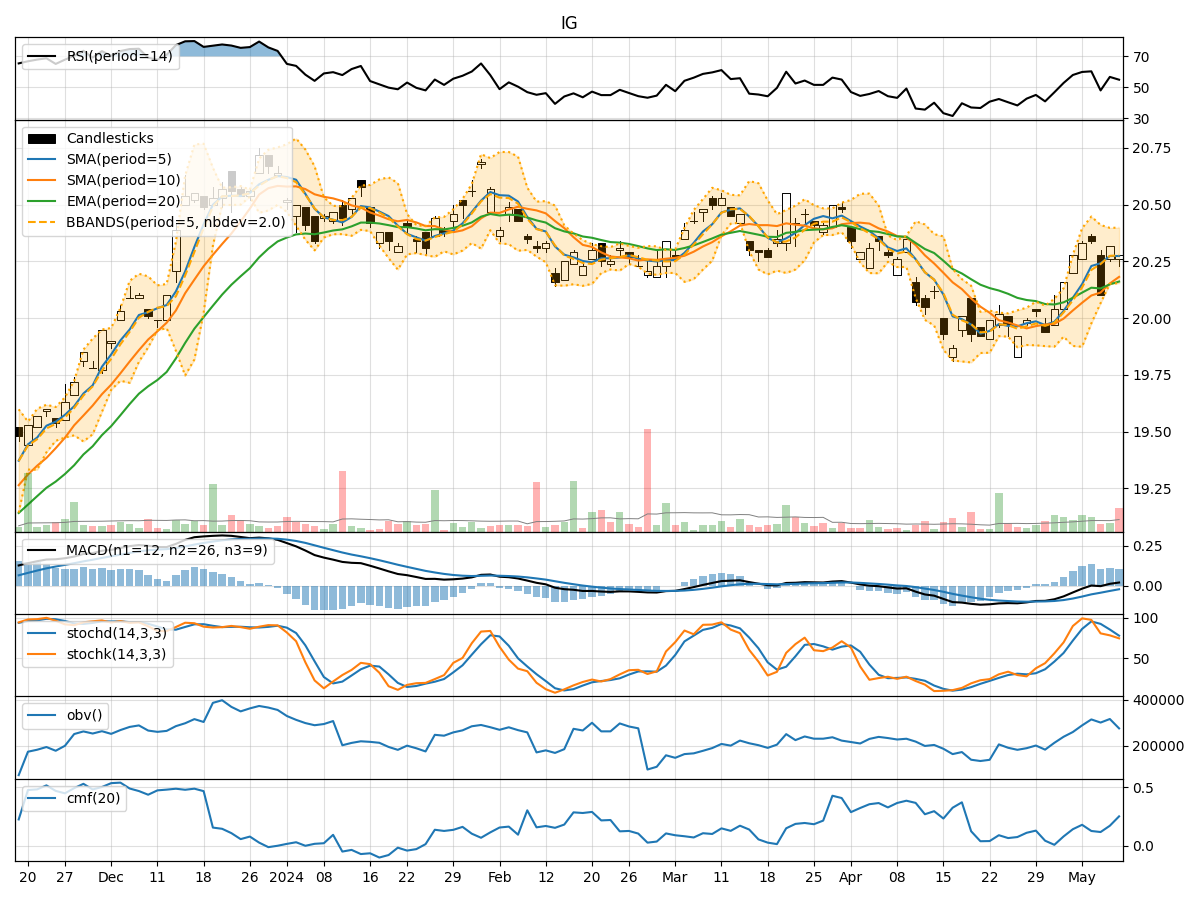
- Moving Averages (MA): The 5-day Moving Average (MA) has been fluctuating around the closing prices, indicating short-term price trends. The Simple Moving Average (SMA) and Exponential Moving Average (EMA) show a slight upward trend.
- MACD: The Moving Average Convergence Divergence (MACD) has been positive, with the MACD line consistently above the signal line, suggesting bullish momentum.
- MACD Histogram: The MACD Histogram has been positive, indicating an increase in bullish momentum.
Momentum Indicators:
- RSI: The Relative Strength Index (RSI) has been fluctuating around the neutral zone, indicating indecision in the market.
- Stochastic Oscillator: The Stochastic Oscillator shows a downward trend, moving towards oversold territory.
- Williams %R: The Williams %R indicator suggests an oversold market condition.
Volatility Indicators:
- Bollinger Bands: The Bollinger Bands show a narrowing range, indicating decreasing volatility.
- Bollinger %B: The Bollinger %B is below 1, suggesting the stock is trading below the lower band, potentially indicating an oversold condition.
Volume Indicators:
- On-Balance Volume (OBV): The OBV has been fluctuating, indicating mixed buying and selling pressure.
- Chaikin Money Flow (CMF): The CMF shows a slight increase, indicating potential buying pressure.
Key Observations and Opinions:
- Trend: The trend indicators suggest a bullish sentiment in the short term, with moving averages and MACD signaling positive momentum.
- Momentum: Momentum indicators show mixed signals, with RSI indicating neutrality, Stochastic Oscillator pointing towards oversold conditions, and Williams %R signaling oversold levels.
- Volatility: Volatility indicators suggest a decrease in volatility, potentially leading to a period of consolidation.
- Volume: Volume indicators show mixed signals, with OBV fluctuating and CMF indicating a slight increase in buying pressure.
Conclusion:
Based on the analysis of the technical indicators, the next few days' possible stock price movement for IG stock is likely to be sideways with a slight bullish bias. The trend indicators support a bullish sentiment, while momentum indicators show mixed signals. Volatility is expected to decrease, leading to a period of consolidation, and volume indicators suggest a balance between buying and selling pressure. Traders should closely monitor key support and resistance levels for potential entry and exit points.