Technical Analysis of IGBH 2024-05-10
Overview:
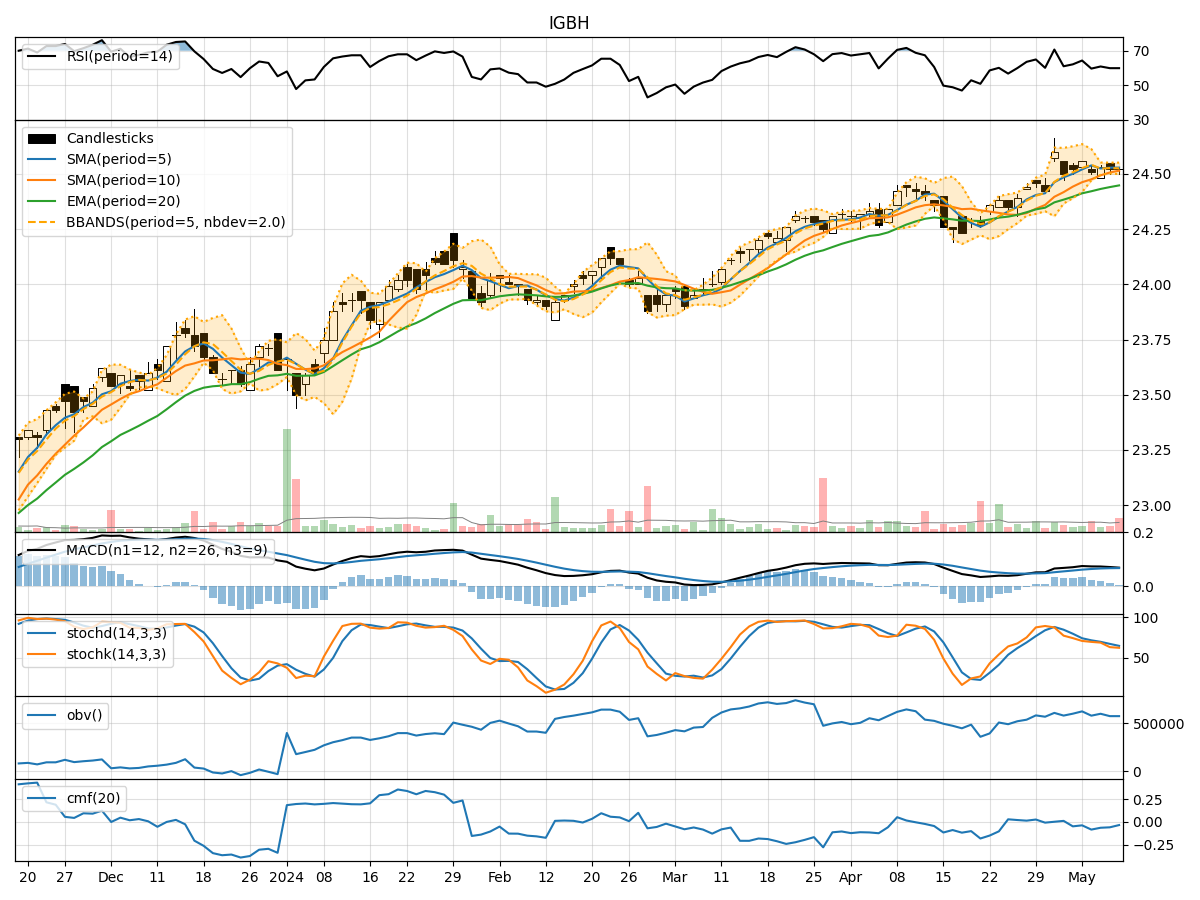
In analyzing the technical indicators for IGBH over the last 5 days, we will delve into the trend, momentum, volatility, and volume indicators to provide a comprehensive outlook on the possible stock price movement. By examining these key factors, we aim to offer valuable insights and predictions for the upcoming trading days.
Trend Analysis:
- Moving Averages (MA): The 5-day Moving Average (MA) has been relatively stable around the closing price, indicating a neutral trend.
- MACD: The Moving Average Convergence Divergence (MACD) shows a slight positive momentum, with the MACD line above the signal line.
- EMA: The Exponential Moving Average (EMA) has been gradually increasing, suggesting a potential bullish trend.
Key Observation: The trend indicators point towards a potential bullish sentiment in the short term.
Momentum Analysis:
- RSI: The Relative Strength Index (RSI) has been fluctuating around the neutral zone, indicating indecision in the market.
- Stochastic Oscillator: Both %K and %D of the Stochastic Oscillator have been declining, signaling a potential bearish momentum.
- Williams %R: The Williams %R is in the oversold territory, suggesting a possible reversal in the near future.
Key Observation: Momentum indicators are mixed, with a slight bearish bias in the short term.
Volatility Analysis:
- Bollinger Bands (BB): The Bollinger Bands have narrowed, indicating decreased volatility in the stock price.
- Bollinger %B: The %B indicator is hovering around the middle band, reflecting a period of consolidation.
- Average True Range (ATR): The ATR has decreased, suggesting a decrease in price volatility.
Key Observation: Volatility indicators suggest a period of consolidation and reduced price fluctuations.
Volume Analysis:
- On-Balance Volume (OBV): The OBV has been relatively flat, indicating a balance between buying and selling pressure.
- Chaikin Money Flow (CMF): The CMF is negative, suggesting a slight outflow of money from the stock.
Key Observation: Volume indicators show a lack of significant buying or selling pressure.
Conclusion:
Based on the analysis of the technical indicators, the next few days for IGBH could see sideways movement with a slight bearish bias in momentum. The trend indicators suggest a potential bullish sentiment in the short term, while volatility indicators point towards a period of consolidation with reduced price fluctuations. Volume indicators indicate a balanced market with no clear dominance of buying or selling pressure.
Overall, the stock is likely to experience sideways movement with a potential for a bullish breakout in the near future. Traders should closely monitor key support and resistance levels for potential entry and exit points.