Technical Analysis of IGEB 2024-05-10
Overview:
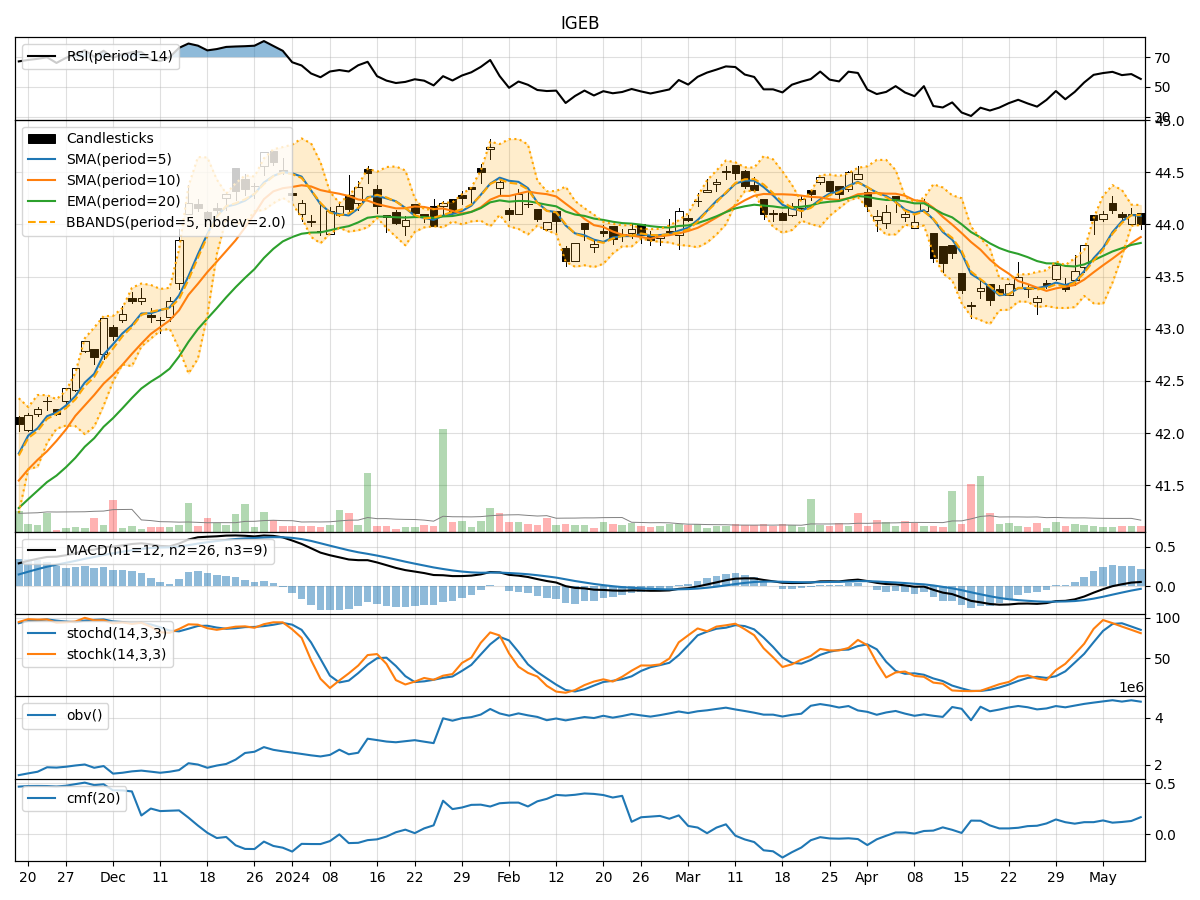
In the last 5 trading days, IGEB stock has shown relatively stable price movements with minor fluctuations. The trend indicators suggest a slightly positive trend, supported by the moving averages and MACD. Momentum indicators indicate a neutral to slightly bearish sentiment, with RSI hovering around the mid-level. Volatility indicators show a narrowing of the Bollinger Bands, indicating decreasing volatility. Volume indicators suggest a consistent accumulation of volume.
Trend Analysis:
- Moving Averages (MA): The 5-day MA is above the 10-day SMA, indicating a short-term bullish trend.
- MACD: The MACD line is above the signal line, suggesting a bullish momentum.
- Conclusion: The trend indicators point towards an upward movement in the stock price.
Momentum Analysis:
- RSI: RSI is around 55, indicating a neutral sentiment without any extreme overbought or oversold conditions.
- Stochastic Oscillator: Both %K and %D are declining but still above 80, suggesting a weakening bullish momentum.
- Conclusion: Momentum indicators suggest a neutral to slightly bearish outlook.
Volatility Analysis:
- Bollinger Bands (BB): The bands are narrowing, indicating decreasing volatility and a potential price breakout.
- Conclusion: Volatility indicators signal a potential breakout in the stock price.
Volume Analysis:
- On-Balance Volume (OBV): OBV has been relatively stable, indicating consistent accumulation of volume.
- Chaikin Money Flow (CMF): CMF is positive, suggesting buying pressure in the stock.
- Conclusion: Volume indicators support the upward movement in the stock price.
Conclusion:
Based on the analysis of technical indicators, the next few days may see the IGEB stock price experience upward movement supported by the positive trend indicators. However, the neutral to slightly bearish momentum indicators and the narrowing Bollinger Bands suggest a potential consolidation phase or a brief pullback before resuming the upward trend. Traders should monitor the price closely for a potential breakout, especially if the price breaches the upper Bollinger Band. It is advisable to consider a cautious approach and wait for confirmation of a sustained bullish momentum before entering new positions.