Technical Analysis of IGF 2024-05-10
Overview:
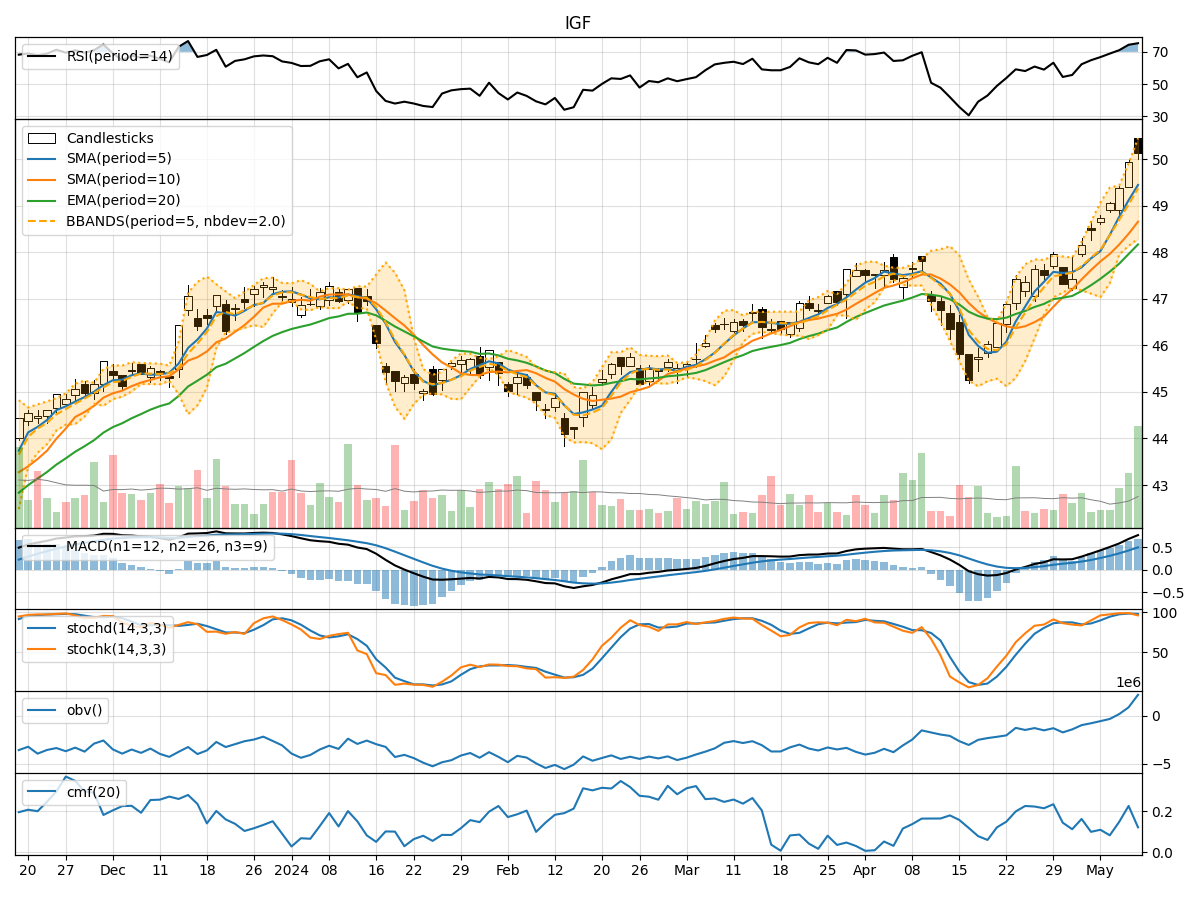
In analyzing the technical indicators for IGF over the last 5 days, we will delve into the trend, momentum, volatility, and volume indicators to provide a comprehensive outlook on the possible stock price movement in the coming days. By examining these key indicators, we aim to offer valuable insights and predictions for informed decision-making.
Trend Analysis:
- Moving Averages (MA): The 5-day MA has been consistently rising, indicating a bullish trend in the short term.
- MACD: The MACD line has been above the signal line, suggesting positive momentum.
- RSI: The RSI is in the overbought territory, signaling a potential reversal or consolidation.
Momentum Analysis:
- Stochastic Oscillator: Both %K and %D are in the overbought zone, hinting at a possible pullback.
- Williams %R: The indicator is in the oversold region, indicating a potential reversal to the upside.
Volatility Analysis:
- Bollinger Bands (BB): The stock price has been trading near the upper band, suggesting increased volatility.
- BB Width: The bands are widening, indicating higher price fluctuations.
Volume Analysis:
- On-Balance Volume (OBV): The OBV has been steadily increasing, reflecting strong buying pressure.
- Chaikin Money Flow (CMF): The CMF is positive, indicating money flow into the stock.
Key Observations:
- The stock is currently in a bullish trend based on moving averages and MACD.
- Momentum indicators suggest a potential pullback due to overbought conditions.
- Volatility is increasing, indicating higher price fluctuations.
- Volume indicators show positive accumulation and money flow into the stock.
Conclusion:
Based on the analysis of technical indicators, the next few days' possible stock price movement for IGF is likely to experience a short-term pullback or consolidation after the recent bullish run. Traders should be cautious of the overbought conditions indicated by momentum indicators and monitor for a potential reversal. However, the overall trend remains bullish, supported by strong buying pressure and positive money flow. Consider setting appropriate stop-loss levels and closely monitoring key support and resistance levels for strategic entry and exit points.