Technical Analysis of IGHG 2024-05-10
Overview:
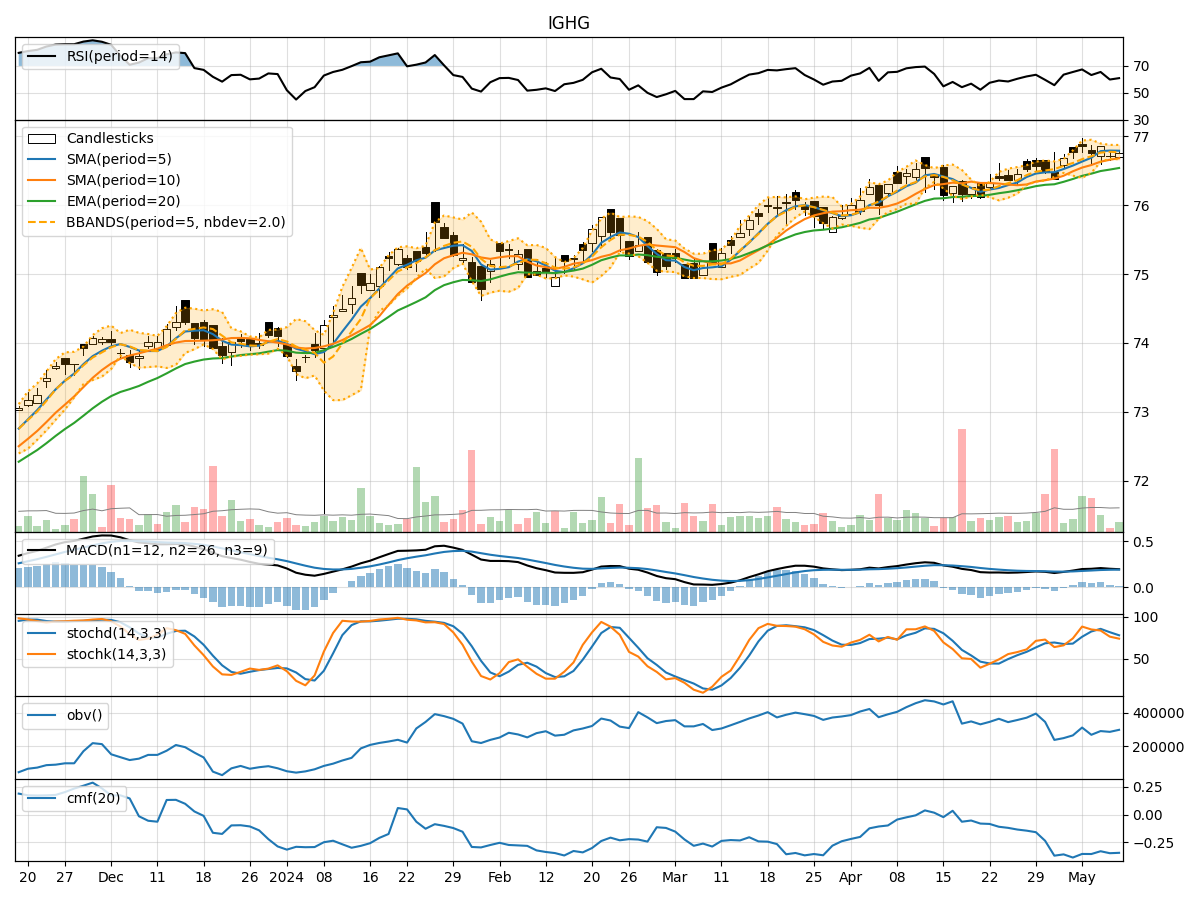
In analyzing the technical indicators for IGHG over the last 5 days, we will delve into the trend, momentum, volatility, and volume indicators to provide a comprehensive assessment of the stock's potential price movement. By examining these key factors, we aim to offer valuable insights and predictions for the next few days.
Trend Indicators:
- Moving Averages (MA): The 5-day MA has been consistently above the closing prices, indicating a short-term uptrend.
- MACD: The MACD line has been positive and above the signal line, suggesting bullish momentum.
- EMA: The exponential moving average has been trending upwards, supporting the bullish sentiment.
Key Observation: The trend indicators point towards a bullish outlook for IGHG.
Momentum Indicators:
- RSI: The Relative Strength Index has been fluctuating but generally staying within the neutral range, indicating balanced momentum.
- Stochastic Oscillator: Both %K and %D have been declining, suggesting a potential weakening of momentum.
- Williams %R: The indicator has been in the oversold territory, signaling a possible reversal.
Key Observation: Momentum indicators are showing a mixed signal, with a slight bearish bias.
Volatility Indicators:
- Bollinger Bands: The bands have been relatively narrow, indicating low volatility.
- Bollinger %B: The %B indicator has been fluctuating around the midline, reflecting a lack of clear direction.
Key Observation: Volatility indicators suggest a sideways or consolidation phase for IGHG.
Volume Indicators:
- On-Balance Volume (OBV): The OBV has been fluctuating, showing no clear trend in volume accumulation.
- Chaikin Money Flow (CMF): The CMF has been negative, indicating selling pressure.
Key Observation: Volume indicators imply a neutral stance with a slight bearish bias.
Conclusion:
Based on the analysis of the technical indicators, the next few days for IGHG could see a mixed price movement. While trend indicators signal a bullish outlook, momentum indicators suggest a bearish bias. Volatility indicators point towards sideways movement, and volume indicators indicate a neutral to bearish sentiment.
Recommendation:
Considering the conflicting signals from different indicators, it is advisable to proceed with caution. Traders may consider waiting for more clarity in momentum and volume before making significant trading decisions. Long-term investors could use any potential dips as buying opportunities, keeping a close eye on key support levels.
Disclaimer:
Remember that technical analysis is not foolproof and should be used in conjunction with other forms of analysis. Market conditions can change rapidly, so it's essential to stay informed and adapt your strategies accordingly.