Technical Analysis of IGIB 2024-05-10
Overview:
In analyzing the technical indicators for IGIB over the last 5 days, we will delve into the trend, momentum, volatility, and volume indicators to provide a comprehensive outlook on the possible stock price movement in the coming days. By examining these key aspects, we aim to offer valuable insights and predictions to guide your investment decisions.
Trend Analysis:
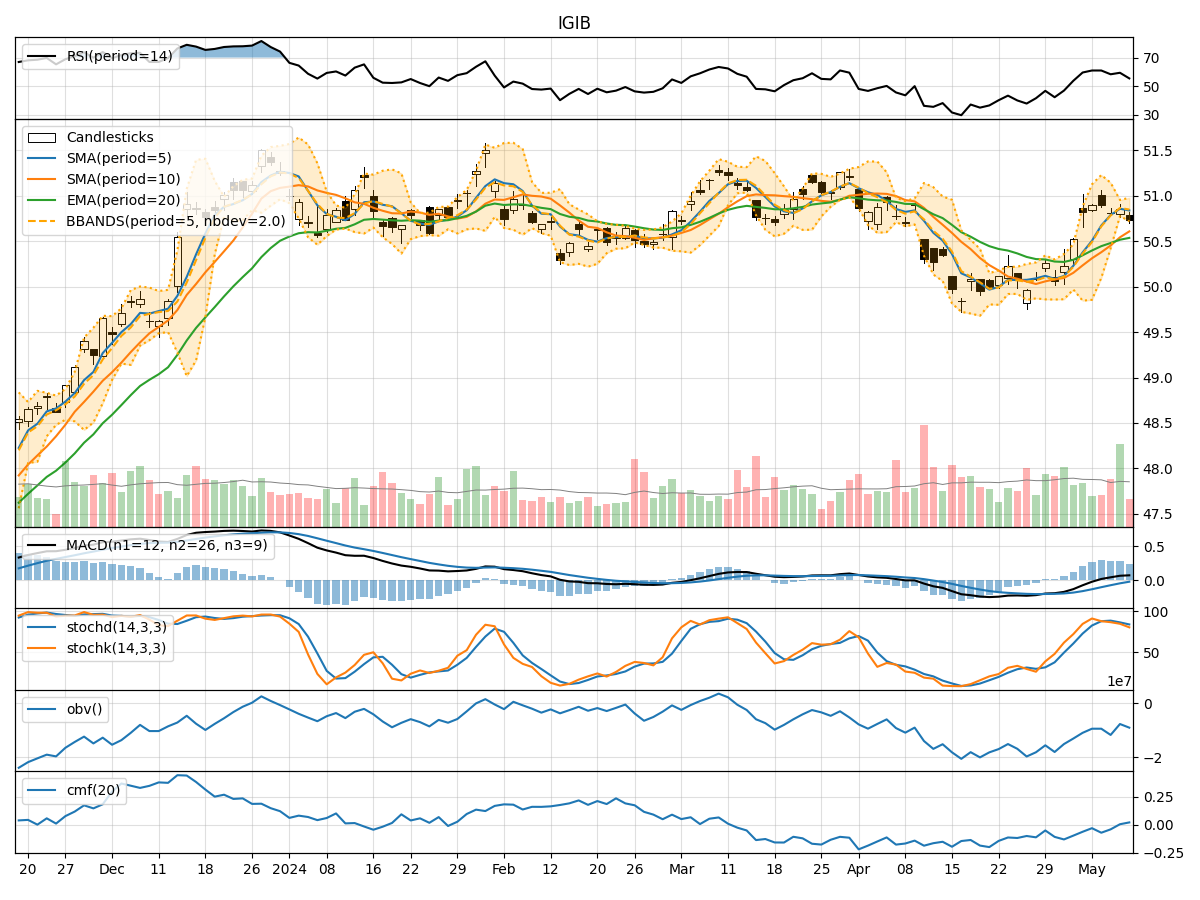
- Moving Averages (MA): The 5-day Moving Average (MA) has been consistently above the Simple Moving Average (SMA) and Exponential Moving Average (EMA), indicating a short-term uptrend.
- MACD: The MACD line has been positive and above the signal line, suggesting bullish momentum in the stock price.
- RSI: The Relative Strength Index (RSI) has been fluctuating around the 50 level, indicating a neutral stance in terms of momentum.
Momentum Analysis:
- Stochastic Oscillator: The Stochastic Oscillator shows that the stock is not in overbought or oversold territory, reflecting a balanced momentum.
- Williams %R: The Williams %R indicator is in the oversold region, suggesting a potential reversal in the stock price.
Volatility Analysis:
- Bollinger Bands (BB): The Bollinger Bands have been narrowing, indicating decreasing volatility in the stock price.
- Average True Range (ATR): The ATR value has been relatively stable, suggesting consistent price movements.
Volume Analysis:
- On-Balance Volume (OBV): The OBV has shown mixed signals, with fluctuations in volume accumulation/distribution.
- Chaikin Money Flow (CMF): The CMF has been negative, indicating selling pressure in the stock.
Key Observations:
- The trend indicators suggest a short-term uptrend in the stock price.
- Momentum indicators show a neutral to slightly bearish sentiment.
- Volatility has been decreasing, indicating potential consolidation.
- Volume indicators reflect mixed signals with selling pressure.
Conclusion:
Based on the analysis of technical indicators, the stock price of IGIB is likely to experience sideways movement in the coming days. The decreasing volatility and mixed volume signals suggest a period of consolidation, while the neutral to slightly bearish momentum indicates a lack of strong directional bias. Traders may expect the stock to trade within a range with no clear trend in the near term. Caution is advised for investors until a clearer trend emerges in the technical signals.