Technical Analysis of IGLB 2024-05-10
Overview:
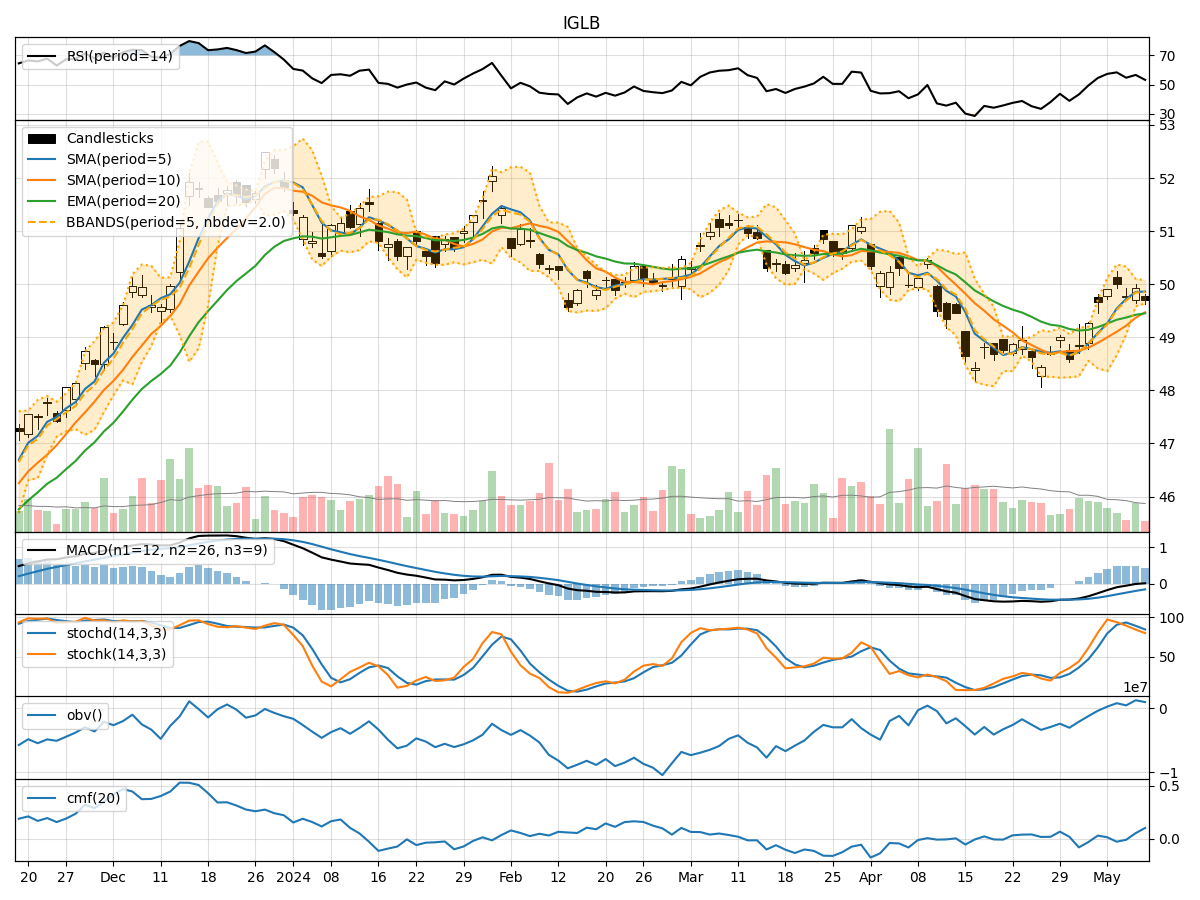
In analyzing the technical indicators for IGLB over the last 5 days, we will delve into the trend, momentum, volatility, and volume indicators to provide a comprehensive outlook on the possible stock price movement in the coming days.
Trend Indicators:
- Moving Averages (MA): The 5-day MA has been consistently above the closing prices, indicating a short-term uptrend.
- MACD: The MACD line has been above the signal line, suggesting bullish momentum.
- RSI: The RSI has been fluctuating around the overbought territory, indicating strong buying pressure.
Momentum Indicators:
- Stochastic Oscillator: Both %K and %D have been gradually decreasing, signaling a potential reversal in momentum.
- Williams %R: The indicator has been in oversold territory, suggesting a possible upcoming bounce.
Volatility Indicators:
- Bollinger Bands (BB): The bands have been narrowing, indicating decreasing volatility.
- BB %B: The %B indicator has been hovering around the middle, suggesting a balanced market sentiment.
Volume Indicators:
- On-Balance Volume (OBV): The OBV has shown a slight increase, indicating accumulation.
- Chaikin Money Flow (CMF): The CMF has been positive, reflecting buying pressure.
Key Observations:
- The trend indicators suggest a bullish sentiment in the short term.
- Momentum indicators show a potential shift in momentum from bullish to neutral.
- Volatility indicators point towards decreasing volatility in the market.
- Volume indicators indicate a slight increase in buying pressure.
Conclusion:
Based on the analysis of the technical indicators, the stock price of IGLB is likely to experience sideways consolidation in the next few days. The bullish trend may lose momentum, leading to a period of consolidation before a potential breakout. Traders should monitor key support and resistance levels for potential entry and exit points.
Recommendation:
- Short-term Traders: Consider taking profits on existing long positions and wait for clearer signals before entering new trades.
- Long-term Investors: Hold positions with a close eye on the evolving market dynamics.
- Risk Management: Implement stop-loss orders to protect capital in case of unexpected price movements.
In conclusion, while the short-term outlook suggests consolidation, the overall trend remains positive. It is essential to stay vigilant and adapt to changing market conditions to make informed trading decisions.