Technical Analysis of IGOV 2024-05-10
Overview:
In analyzing the technical indicators for IGOV over the last 5 days, we will delve into the trend, momentum, volatility, and volume indicators to provide a comprehensive outlook on the possible stock price movement in the coming days. By examining these key indicators, we aim to offer valuable insights and predictions for informed decision-making.
Trend Analysis:
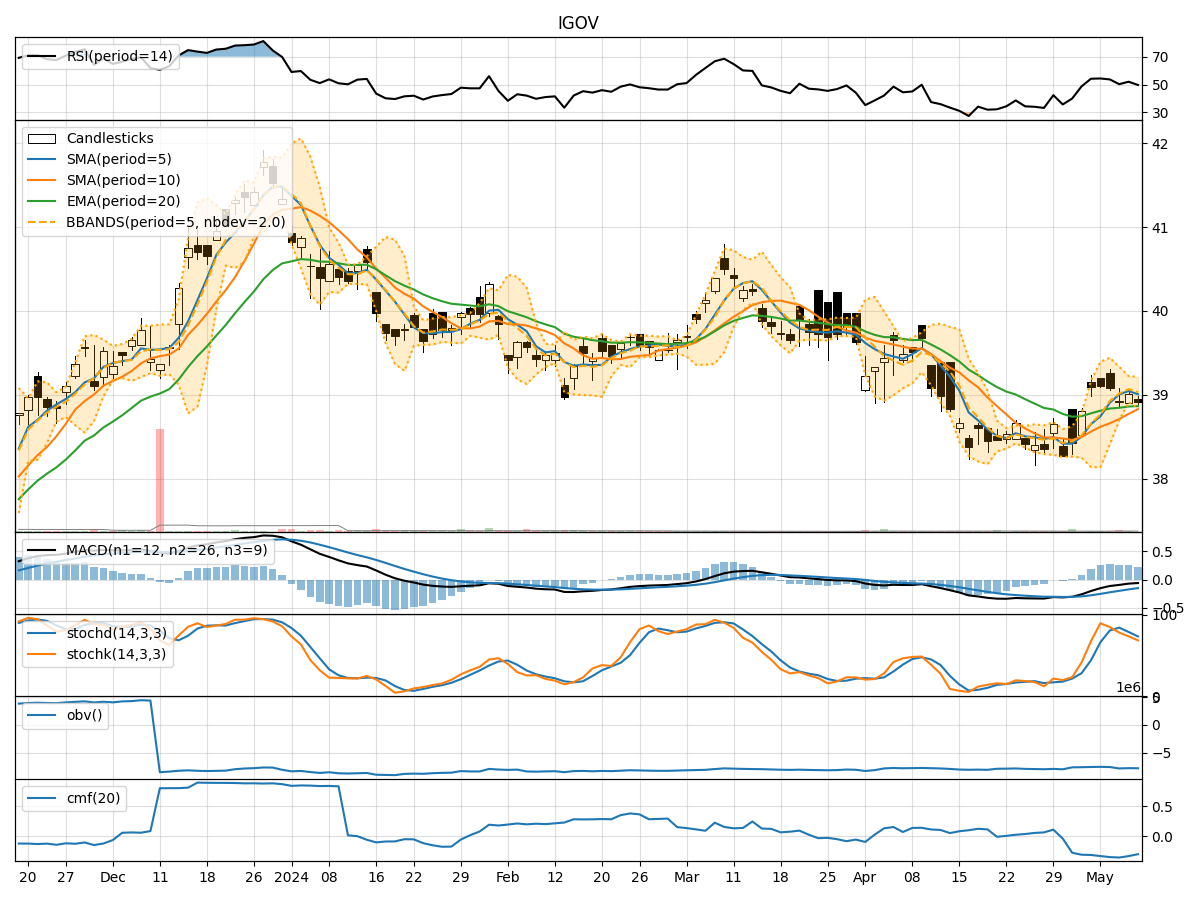
- Moving Averages (MA): The 5-day Moving Average (MA) has been relatively stable around $39, indicating a moderate trend.
- MACD: The Moving Average Convergence Divergence (MACD) has shown a negative trend, with the MACD line consistently below the signal line.
- EMA: The Exponential Moving Average (EMA) has been slightly declining, suggesting a weakening trend.
Key Observation: The trend indicators point towards a slightly bearish sentiment in the short term.
Momentum Analysis:
- RSI: The Relative Strength Index (RSI) has been fluctuating around the neutral zone, indicating indecision in the market.
- Stochastic Oscillator: Both %K and %D have been decreasing, signaling a potential bearish momentum.
- Williams %R: The Williams %R is in the oversold territory, suggesting a possible reversal.
Key Observation: The momentum indicators reflect a bearish bias in the near future.
Volatility Analysis:
- Bollinger Bands: The Bollinger Bands have been narrowing, indicating decreasing volatility in the stock price.
- Bollinger %B: The %B is hovering around the middle band, suggesting a balanced volatility level.
Key Observation: Volatility is contracting, which may lead to a period of consolidation or a breakout.
Volume Analysis:
- On-Balance Volume (OBV): The OBV has been fluctuating, showing no clear trend in volume accumulation.
- Chaikin Money Flow (CMF): The CMF has been negative, indicating selling pressure in the market.
Key Observation: Volume indicators suggest mixed signals with no clear direction.
Conclusion:
Based on the analysis of the technical indicators, the overall outlook for IGOV in the next few days leans towards a bearish sentiment. The trend indicators show a weakening trend, momentum indicators signal bearish momentum, and volatility indicators point towards a potential period of consolidation. Volume indicators provide mixed signals, reflecting uncertainty in market participation.
Therefore, the possible stock price movement for IGOV in the next few days is likely to be on a downward trajectory with a potential for consolidation. Traders should exercise caution and consider risk management strategies in their decision-making process.