Technical Analysis of IGTR 2024-05-10
Overview:
In analyzing the technical indicators for IGTR over the last 5 days, we will delve into the trend, momentum, volatility, and volume indicators to provide a comprehensive outlook on the possible stock price movement. By examining these key indicators, we aim to offer valuable insights and predictions for the upcoming days.
Trend Indicators:
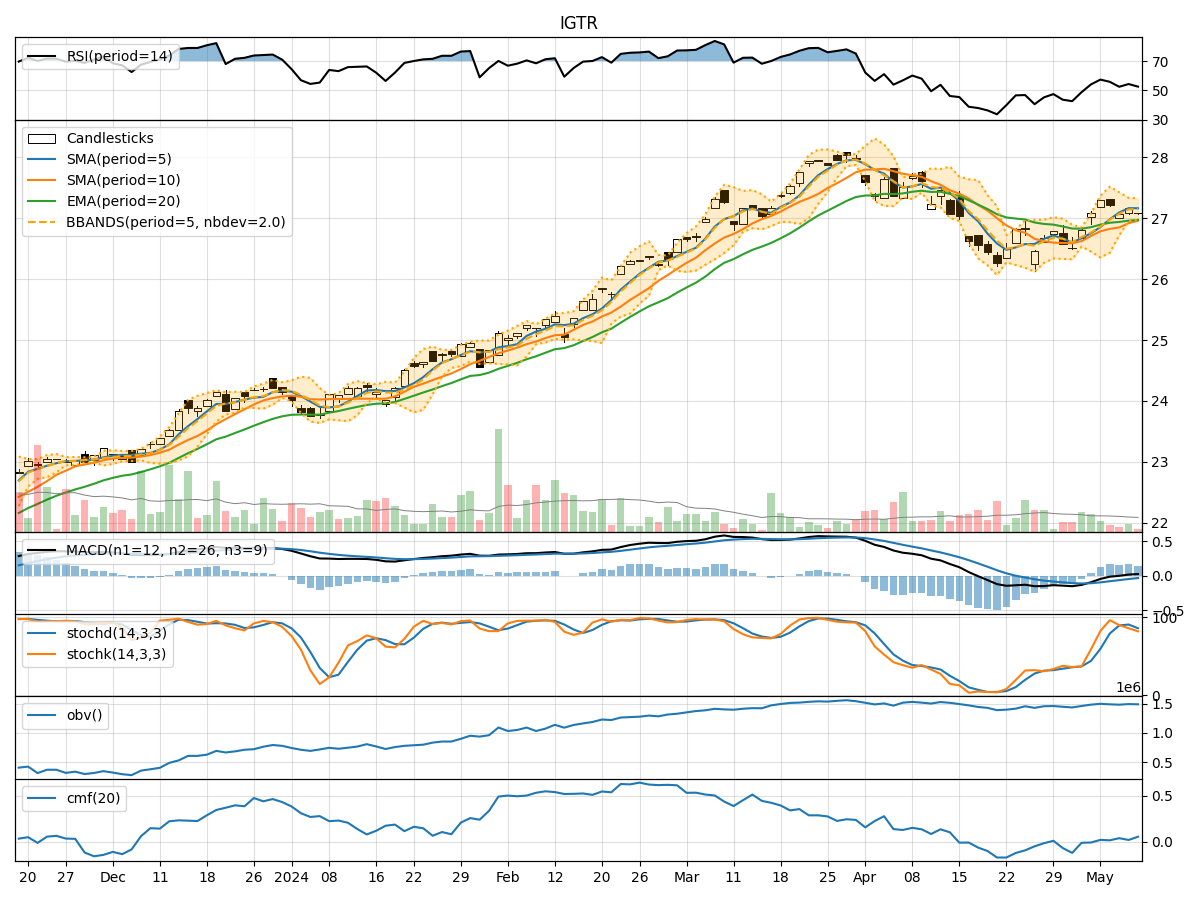
- Moving Averages (MA): The 5-day Moving Average (MA) has been consistently above the Simple Moving Average (SMA) and Exponential Moving Average (EMA), indicating a bullish trend.
- MACD: The MACD line has been positive, showing an upward momentum in the stock price.
- MACD Histogram: The MACD Histogram has been consistently above the signal line, further supporting the bullish trend.
Momentum Indicators:
- RSI: The Relative Strength Index (RSI) has been fluctuating around the neutral zone, suggesting a lack of strong momentum in either direction.
- Stochastic Oscillator: Both %K and %D have been in the overbought region, indicating a potential reversal or consolidation.
- Williams %R: The Williams %R is in the oversold region, signaling a possible buying opportunity.
Volatility Indicators:
- Bollinger Bands: The Bollinger Bands have been relatively narrow, indicating low volatility in the stock price.
- Bollinger %B: The %B indicator has been hovering around the middle, suggesting a balanced market sentiment.
Volume Indicators:
- On-Balance Volume (OBV): The OBV has shown a slight increase, indicating some accumulation by investors.
- Chaikin Money Flow (CMF): The CMF has been positive, reflecting buying pressure in the stock.
Key Observations:
- The trend indicators suggest a bullish sentiment in the stock price, supported by the moving averages and MACD.
- Momentum indicators show mixed signals, with RSI indicating neutrality, Stochastic Oscillator hinting at a potential reversal, and Williams %R signaling oversold conditions.
- Volatility indicators point towards low volatility, which may lead to a period of consolidation or sideways movement.
- Volume indicators indicate some accumulation and buying pressure in the stock.
Conclusion:
Based on the analysis of the technical indicators, the next few days for IGTR could see sideways movement or consolidation in the stock price. While the trend remains bullish, the mixed signals from momentum indicators and low volatility suggest a period of indecision in the market. Traders and investors should closely monitor key support and resistance levels for potential breakout opportunities.