Technical Analysis of IHY 2024-05-10
Overview:
In analyzing the technical indicators for IHY over the last 5 days, we will delve into the trend, momentum, volatility, and volume indicators to provide a comprehensive outlook on the possible stock price movement in the coming days. By examining these key aspects, we aim to offer valuable insights and recommendations for potential trading strategies.
Trend Analysis:
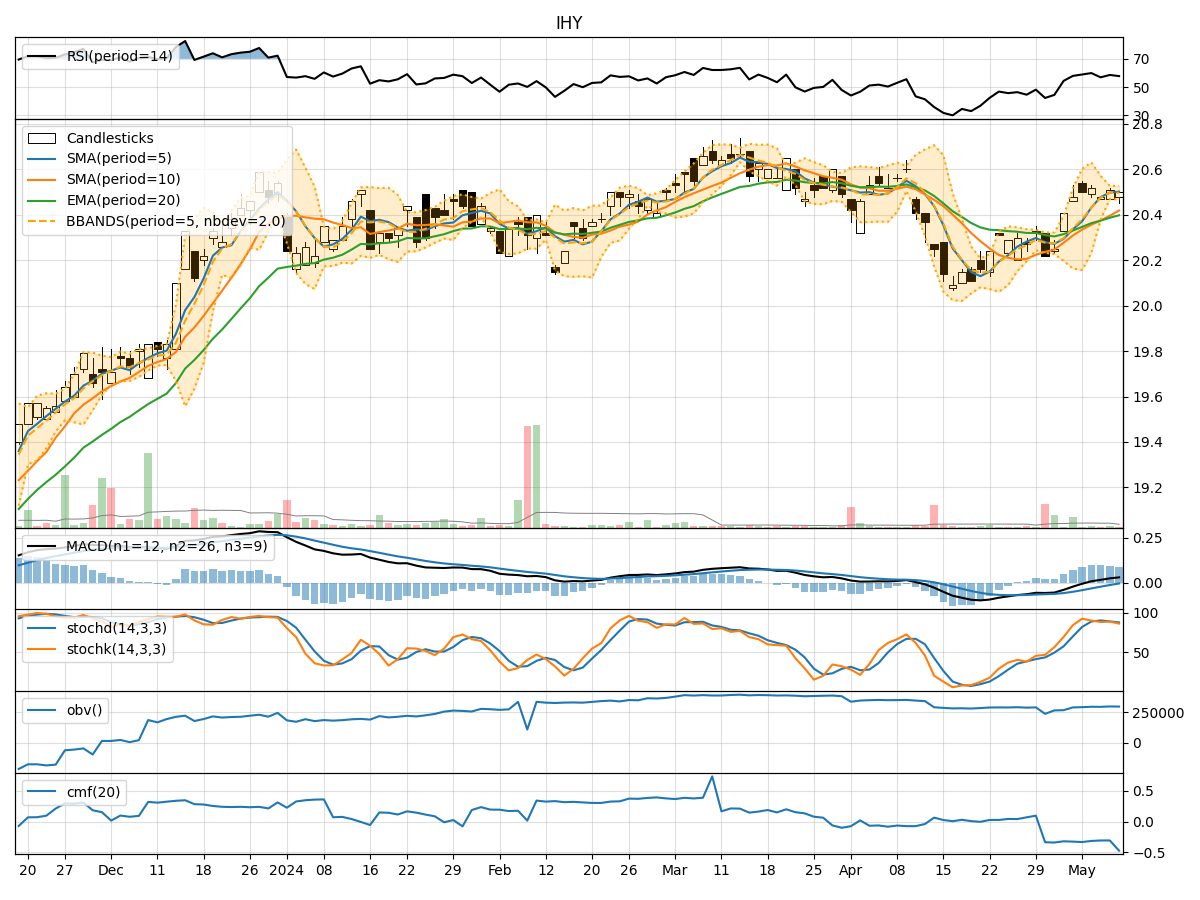
- Moving Averages (MA): The 5-day Moving Average (MA) has been consistently above the Simple Moving Average (SMA) and Exponential Moving Average (EMA), indicating a short-term uptrend.
- MACD: The MACD line has been consistently above the signal line, with both lines showing an upward trend, suggesting bullish momentum.
Key Observation: The trend indicators suggest a bullish sentiment in the short term.
Momentum Analysis:
- RSI: The Relative Strength Index (RSI) has been hovering around 60, indicating a neutral momentum.
- Stochastic Oscillator: Both %K and %D have been fluctuating in the overbought territory, suggesting a potential reversal.
- Williams %R: The Williams %R is showing oversold conditions, indicating a possible buying opportunity.
Key Observation: The momentum indicators signal a mixed sentiment with a slight bearish bias.
Volatility Analysis:
- Bollinger Bands (BB): The stock price has been trading within the Bollinger Bands, indicating normal volatility.
Key Observation: Volatility remains stable with no significant deviations.
Volume Analysis:
- On-Balance Volume (OBV): The OBV has been relatively flat, suggesting a balance between buying and selling pressure.
- Chaikin Money Flow (CMF): The CMF is negative, indicating a bearish money flow trend.
Key Observation: Volume indicators reflect a neutral sentiment with a slight bearish bias.
Conclusion:
Based on the analysis of the technical indicators, the overall outlook for IHY in the next few days leans towards a bullish trend continuation in the short term, supported by the positive trend indicators. However, the mixed momentum signals and slightly bearish volume indicators suggest a potential consolidation or minor pullback before resuming the uptrend.
Key Conclusion: The stock is likely to experience upward movement in the coming days, but traders should remain cautious of potential short-term corrections due to the mixed momentum signals.